Arcadium Lithium Limited: Focuses on the exploration and development of lithium resources for the energy sector.
Ticker code: ASX:LTM
Market Information
| Market Capitalisation | Enterprise Value | Shares Outstanding | Free Float [%] | Free Float Value |
|---|---|---|---|---|
| $99,696,552 | $2,434,967,552 | 2427470080 | 62.7 | $62,506,500 |
Balance Sheet & Quality
| Equity | Cash | Debt | Return On Equity (ROE) | EBITDA 24 Margin [%] | Net Debt / Equity [%] | Rule of 40 |
|---|---|---|---|---|---|---|
| $757,370,701 | $0 | $844,281,984 | 2.9 | 36.1 | 86.0 | 56.7 |
Technicals & Short Data
| 3EMA Status | Volatility [%] | Value Traded Today | Average Daily Liquidity | Short [%] | Days To Cover |
|---|---|---|---|---|---|
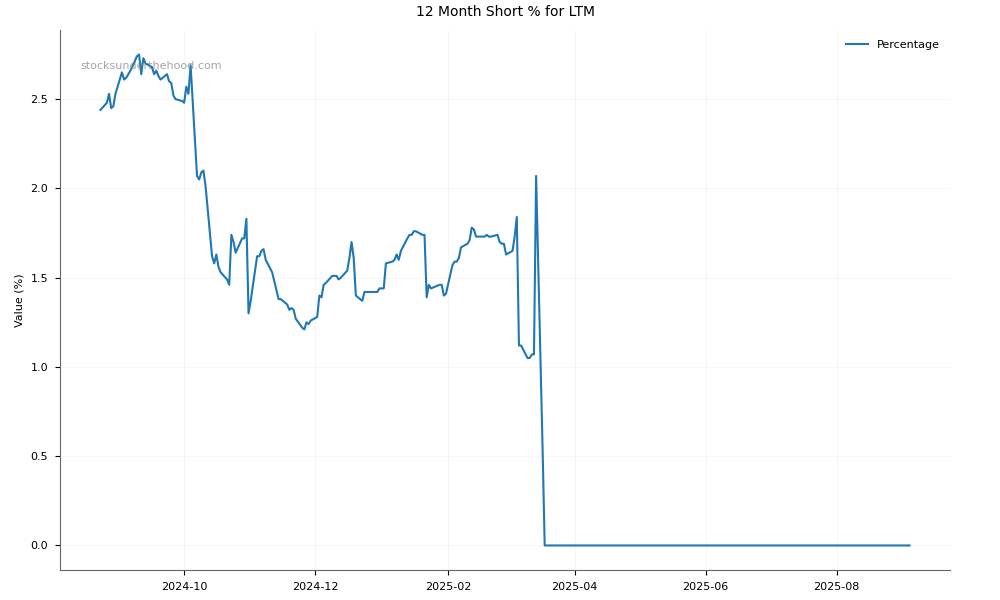
| Positive | 109.4 | $12,357,938 | $9,274,310 | 1.07 | 0.1 |
Valuation
| Price To Sales | Price To Book | PER 2023 | PER 2024 | 13Y Median PER Low | PER 2025e | 13Y Median PER High | PER 2026e | Last Updated |
|---|---|---|---|---|---|---|---|---|
| 16.9 | 2.2 | None | 4.1 | 20.2 | 3.9 | 48.5 | 5.8 | 26/2/25 |
Income Statement
| Revenue 2024 [M] | Revenue 2025e [M] | Revenue 2026e [M] | Revenue 24 to 25e [%] | Revenue 25e to 26e [%] | EBITDA 2024 [M] | EBITDA 2025e [M] | EBITDA 2026e [M] | EBITDA 24 to 25e [%] | EBITDA 25e to 26e [%] |
|---|---|---|---|---|---|---|---|---|---|
| $987 | $1,189 | $1,431 | 20.5 | 20.3 | $356.23 | $467.86 | $607.54 | 31.3 | 29.9 |
Dividends
| Previous Dividend | Last Dividend | Franking [%] | Ex-Div Date | Gross Yield [%] |
|---|---|---|---|---|
| None | None | None | None | 0.0 |
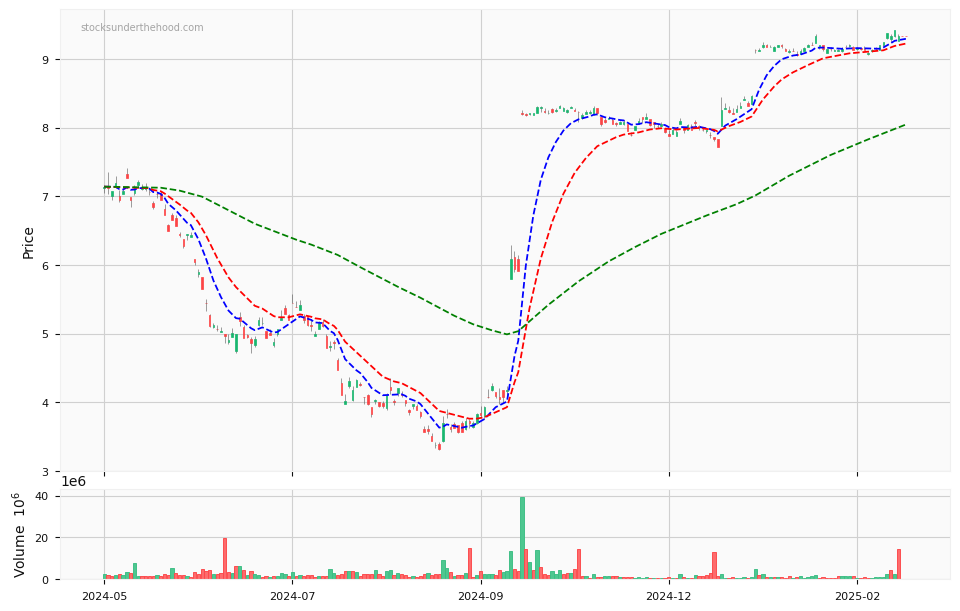
ASX:LTM Price Chart with Volume and 3EMA over the Last 12 Months
| Last Traded Price | Change [%] | 1 Week [%] | 1 Month [%] | 3 Months [%] | 6 Months [%] | 12 Months [%] |
|---|---|---|---|---|---|---|
| $0.700 | -4.8 | 13.8 | 10.2 | -91.2 | -80.4 | -89.9 |
ASX:LTM Short Positions over the Last 12 Months