Articore Group Limited (ASX:ATG) operates online marketplaces like Redbubble.com and TeePublic.com, connecting artists with customers. These platforms sell art and designs on apparel, stationery, housewares, bags, and wall art.
Ticker code: ATG
Sector: Consumer Cyclical | Industry: Internet Retail | Website: https://www.articore.com
Market Information
| Market Capitalisation | Enterprise Value | Shares Outstanding | Free Float [%] | Free Float Value |
|---|---|---|---|---|
| $88,744,508 | $66,903,508 | 311384244 | 55.46 | $49,215,121 |
Balance Sheet & Quality
| Equity | Cash | Debt | Return On Equity (ROE) | EBITDA 25 Margin [%] | Net Debt / Equity [%] | Rule of 40 |
|---|---|---|---|---|---|---|
| $50,444,249 | $28,418,000 | $6,577,000 | 0.0 | 0.5 | -43.3 | -16.3 |
Technicals & Short Data
| 3EMA Status | Volatility [%] | Value Traded Today | Average Daily Liquidity | Short [%] | Days To Cover |
|---|---|---|---|---|---|
| Positive | 9.9 | $54,532 | $81,980 | 0.02 | 0.2 |
Dividends
| Previous Dividend | Last Dividend | Franking [%] | Ex-Div Date | Gross Yield [%] |
|---|---|---|---|---|
| None | None | None | None | 0.0 |
Price Performance Snapshot
| Last Traded Price | Change [%] | 1 Week [%] | 1 Month [%] | 3 Months [%] | 6 Months [%] | 12 Months [%] |
|---|---|---|---|---|---|---|
| $0.285 | -8.1 | -8.1 | -1.7 | 35.7 | 103.6 | -26.9 |
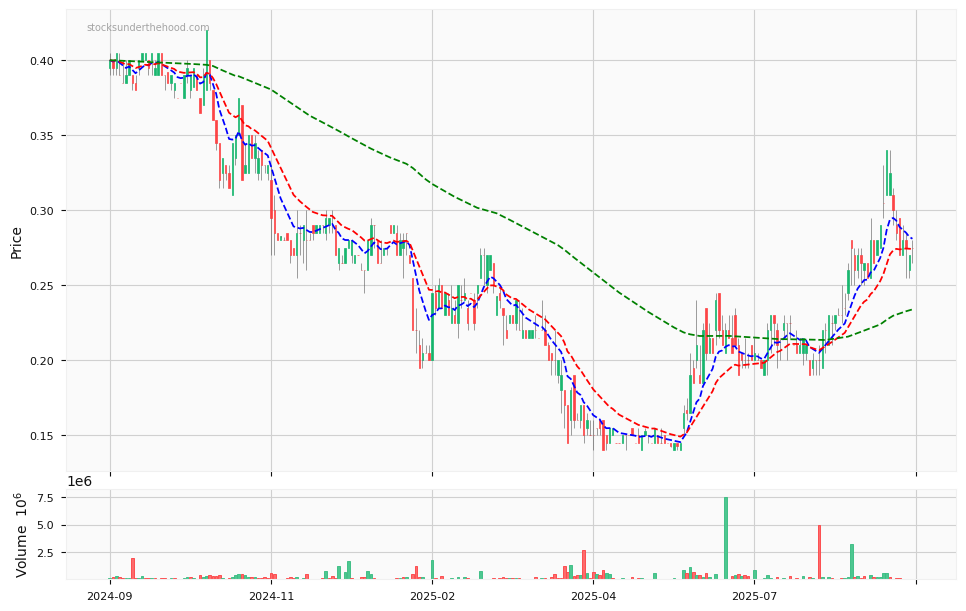
ATG Price Chart with Volume and 3EMA
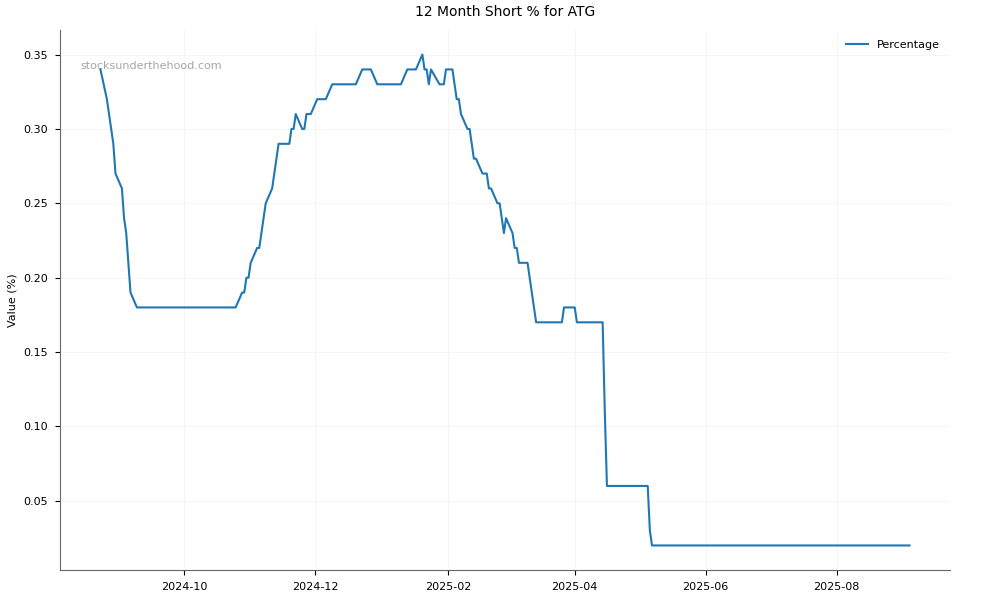
ATG Short Positions
Click HERE to understand why the above moving averages have been chosen.