Baby Bunting Group Limited is Australia’s largest specialty retailer of baby goods, offering a comprehensive range of products and services for infants and parents.
Ticker code: BBN
Sector: Consumer Cyclical | Industry: Specialty Retail | Website: https://www.babybunting.com.au
Market Information
| Market Capitalisation | Enterprise Value | Shares Outstanding | Free Float [%] | Free Float Value |
|---|---|---|---|---|
| $365,581,967 | $519,618,967 | 135400726 | 79.92 | $292,170,264 |
Balance Sheet & Quality
| Equity | Cash | Debt | Return On Equity (ROE) | EBITDA 25 Margin [%] | Net Debt / Equity [%] | Rule of 40 |
|---|---|---|---|---|---|---|
| $113,059,602 | $12,379,000 | $166,416,000 | 10.7 | 12.6 | 136.2 | 15.4 |
Technicals & Short Data
| 3EMA Status | Volatility [%] | Value Traded Today | Average Daily Liquidity | Short [%] | Days To Cover |
|---|---|---|---|---|---|
| Partial | 5.8 | $515,041 | $1,220,297 | 0.37 | 1.1 |
Dividends
| Previous Dividend | Last Dividend | Franking [%] | Ex-Div Date | Gross Yield [%] |
|---|---|---|---|---|
| None | None | 100.0 | 2024-03-04 | 0.0 |
Price Performance Snapshot
| Last Traded Price | Change [%] | 1 Week [%] | 1 Month [%] | 3 Months [%] | 6 Months [%] | 12 Months [%] |
|---|---|---|---|---|---|---|
| $2.700 | None | 0.4 | -6.6 | -10.0 | 54.3 | 49.2 |
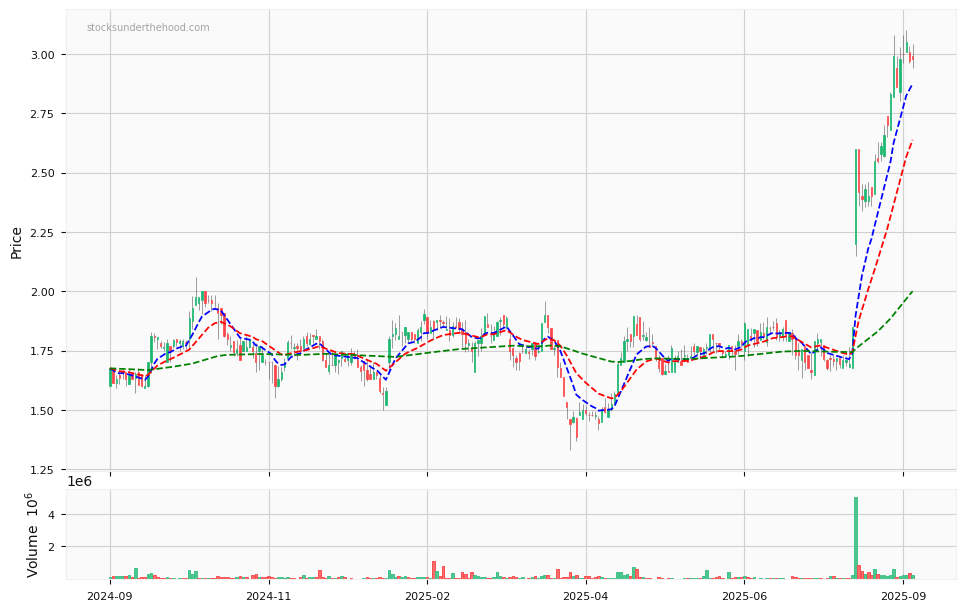
BBN Price Chart with Volume and 3EMA
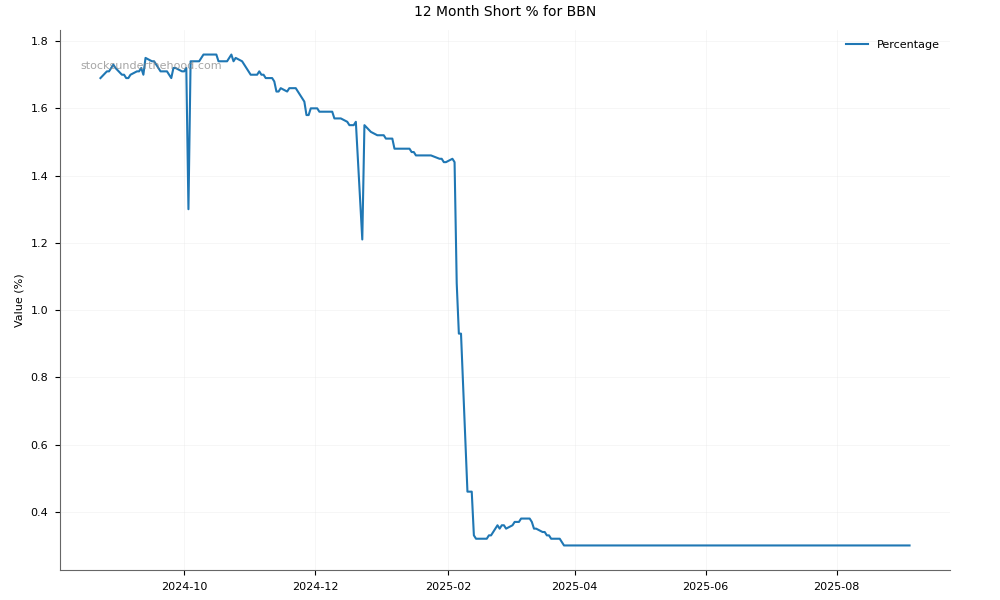
BBN Short Positions
Click HERE to understand why the above moving averages have been chosen.