Bannerman Energy Ltd is engaged in the exploration and development of uranium properties, primarily focusing on its Etango Uranium Project in Namibia, aiming to become a significant uranium producer.
Ticker code: BMN
Sector: Energy | Industry: Uranium | Website: https://bannermanenergy.com
Market Information
| Market Capitalisation | Enterprise Value | Shares Outstanding | Free Float [%] | Free Float Value |
|---|---|---|---|---|
| $680,447,552 | $630,740,480 | 207453525.0 | 94.8 | $645,039,556 |
Balance Sheet & Quality
| Equity | Cash | Debt | Return On Equity (ROE) | EBITDA 25 Margin [%] | Net Debt / Equity [%] | Rule of 40 |
|---|---|---|---|---|---|---|
| $220,108,180 | $58,636,000 | $68,000 | None | None | -26.6 | None |
Technicals & Short Data
| 3EMA Status | Volatility [%] | Value Traded Today | Average Daily Liquidity | Short [%] | Days To Cover |
|---|---|---|---|---|---|
| Positive | 9.2 | $1,463,323 | $3,975,517 | None | 0.0 |
Dividends
| Previous Dividend | Last Dividend | Franking [%] | Ex-Div Date | Gross Yield [%] |
|---|---|---|---|---|
| None | None | None | None | None |
Price Performance Snapshot
| Last Traded Price | Change [%] | 1 Week [%] | 1 Month [%] | 3 Months [%] | 6 Months [%] | 12 Months [%] |
|---|---|---|---|---|---|---|
| $3.280 | 1.5 | 12.3 | -0.3 | 1.5 | 15.1 | 18.4 |
BMN Price Chart with Volume and 3EMA

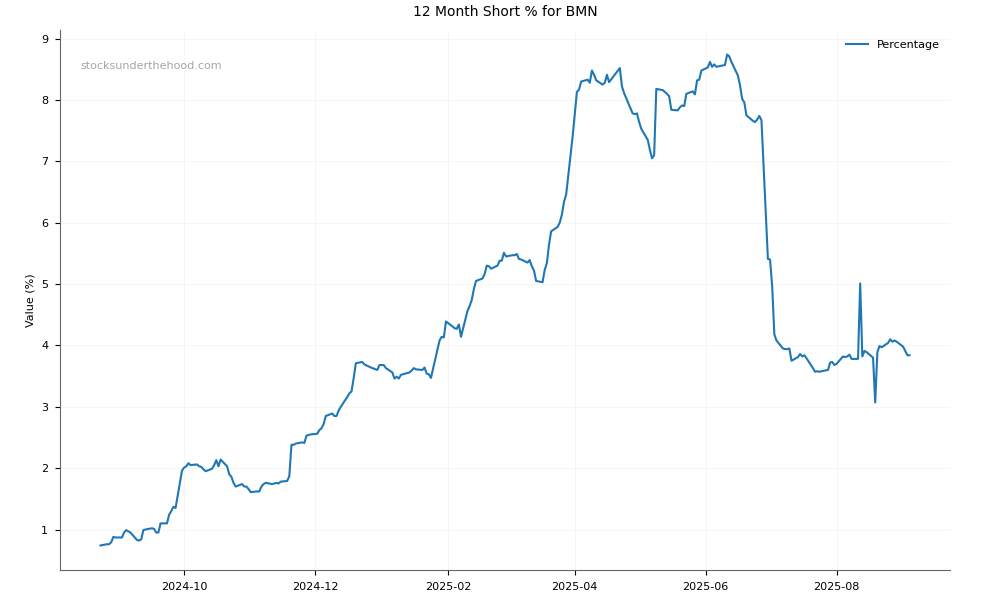
BMN Short Positions
Click HERE to understand why the above moving averages have been chosen.