BetMakers Technology Group Ltd is a global provider of technology and data solutions for the betting industry, offering platforms and services to wagering operators.
Ticker code: BET
Sector: Consumer Cyclical | Industry: Gambling | Website: https://betmakers.com
Market Information
| Market Capitalisation | Enterprise Value | Shares Outstanding | Free Float [%] | Free Float Value |
|---|---|---|---|---|
| $190,161,029 | $161,321,029 | 1118594275 | 72.13 | $137,158,187 |
Balance Sheet & Quality
| Equity | Cash | Debt | Return On Equity (ROE) | EBITDA 25 Margin [%] | Net Debt / Equity [%] | Rule of 40 |
|---|---|---|---|---|---|---|
| $98,436,296 | $30,313,000 | $1,473,000 | -22.7 | 1.9 | -29.3 | -11.2 |
Technicals & Short Data
| 3EMA Status | Volatility [%] | Value Traded Today | Average Daily Liquidity | Short [%] | Days To Cover |
|---|---|---|---|---|---|
| Positive | 11.3 | $52,866 | $343,650 | 0.2 | 1.1 |
Dividends
| Previous Dividend | Last Dividend | Franking [%] | Ex-Div Date | Gross Yield [%] |
|---|---|---|---|---|
| None | None | None | None | 0.0 |
Price Performance Snapshot
| Last Traded Price | Change [%] | 1 Week [%] | 1 Month [%] | 3 Months [%] | 6 Months [%] | 12 Months [%] |
|---|---|---|---|---|---|---|
| $0.170 | None | 9.7 | 6.3 | None | 54.5 | 54.5 |
BET Price Chart with Volume and 3EMA

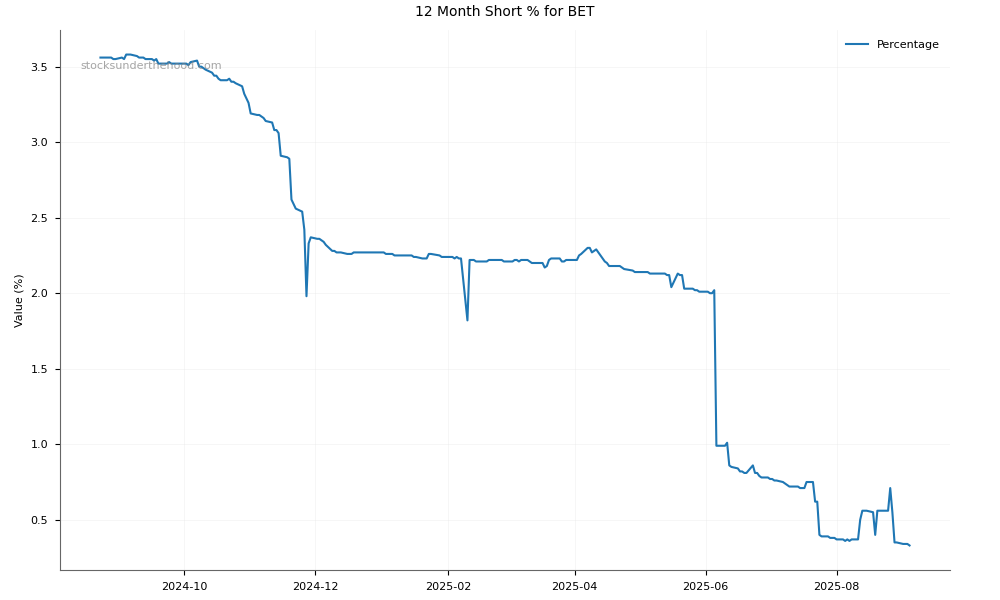
BET Short Positions
Click HERE to understand why the above moving averages have been chosen.