Boss Energy Limited is involved in the exploration and development of uranium projects, primarily focusing on the Honeymoon Uranium Project in South Australia.
Ticker code: BOE
Sector: Energy | Industry: Uranium | Website: https://www.bossenergy.com
Market Information
| Market Capitalisation | Enterprise Value | Shares Outstanding | Free Float [%] | Free Float Value |
|---|---|---|---|---|
| $676,322,061 | $629,064,061 | 414921511 | 94.13 | $636,594,902 |
Balance Sheet & Quality
| Equity | Cash | Debt | Return On Equity (ROE) | EBITDA 25 Margin [%] | Net Debt / Equity [%] | Rule of 40 |
|---|---|---|---|---|---|---|
| $483,798,474 | $47,748,000 | $490,000 | 2.6 | -15.3 | -9.8 | 202.4 |
Technicals & Short Data
| 3EMA Status | Volatility [%] | Value Traded Today | Average Daily Liquidity | Short [%] | Days To Cover |
|---|---|---|---|---|---|
| Negative | 10.1 | $7,613,518 | $15,638,319 | 23.25 | 10.1 |
Dividends
| Previous Dividend | Last Dividend | Franking [%] | Ex-Div Date | Gross Yield [%] |
|---|---|---|---|---|
| None | None | None | None | 0.0 |
Price Performance Snapshot
| Last Traded Price | Change [%] | 1 Week [%] | 1 Month [%] | 3 Months [%] | 6 Months [%] | 12 Months [%] |
|---|---|---|---|---|---|---|
| $1.630 | 1.2 | 3.2 | -10.4 | -17.3 | -57.6 | -36.1 |
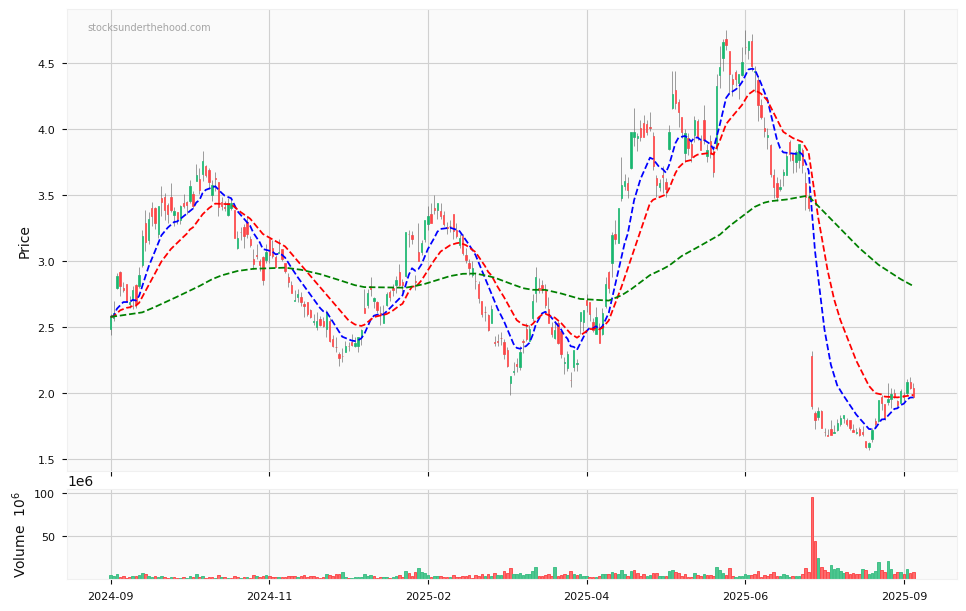
BOE Price Chart with Volume and 3EMA
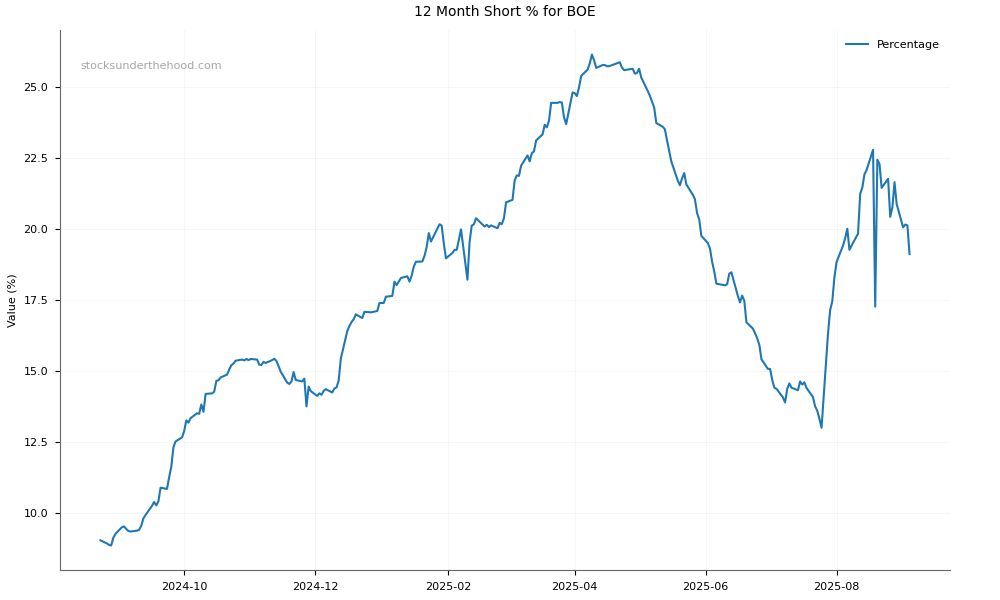
BOE Short Positions
Click HERE to understand why the above moving averages have been chosen.