BrainChip Holdings Ltd is a technology company specializing in neuromorphic computing, developing advanced artificial intelligence solutions and hardware.
Ticker code: BRN
Sector: Technology | Industry: Semiconductors | Website: https://brainchip.com
Market Information
| Market Capitalisation | Enterprise Value | Shares Outstanding | Free Float [%] | Free Float Value |
|---|---|---|---|---|
| $410,201,998 | $397,745,747 | 2344011455 | 70.03 | $287,251,692 |
Balance Sheet & Quality
| Equity | Cash | Debt | Return On Equity (ROE) | EBITDA 25 Margin [%] | Net Debt / Equity [%] | Rule of 40 |
|---|---|---|---|---|---|---|
| $18,752,093 | $13,458,121 | $1,001,870 | -125.0 | None | -66.4 | None |
Technicals & Short Data
| 3EMA Status | Volatility [%] | Value Traded Today | Average Daily Liquidity | Short [%] | Days To Cover |
|---|---|---|---|---|---|
| Negative | 8.2 | $891,669 | $1,855,956 | 4.49 | 9.9 |
Dividends
| Previous Dividend | Last Dividend | Franking [%] | Ex-Div Date | Gross Yield [%] |
|---|---|---|---|---|
| None | None | None | None | 0.0 |
Price Performance Snapshot
| Last Traded Price | Change [%] | 1 Week [%] | 1 Month [%] | 3 Months [%] | 6 Months [%] | 12 Months [%] |
|---|---|---|---|---|---|---|
| $0.175 | -2.8 | -2.8 | -2.8 | -20.5 | -22.2 | -28.6 |
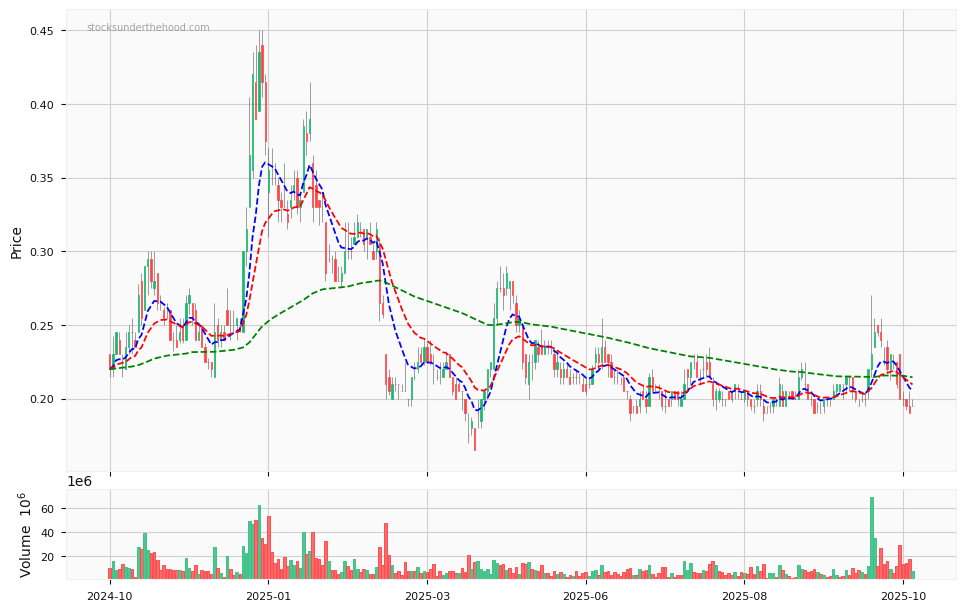
BRN Price Chart with Volume and 3EMA
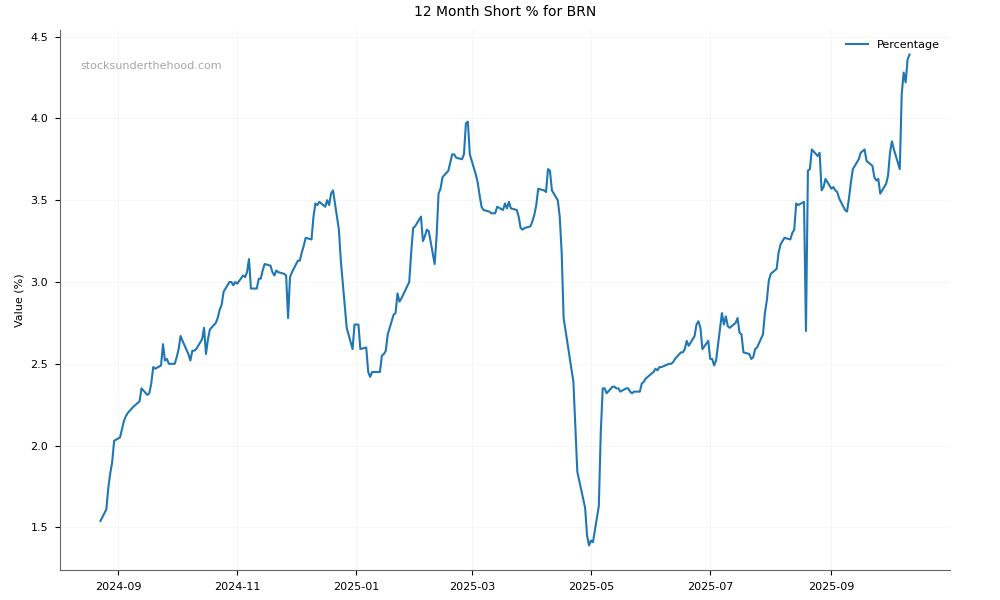
BRN Short Positions
Click HERE to understand why the above moving averages have been chosen.