Ticker code: CAR
CAR Red Flags & Risk Indicators
⚠️
⚠️
⚠️ RED FLAGS: 2 identified
- Increasing Shorts
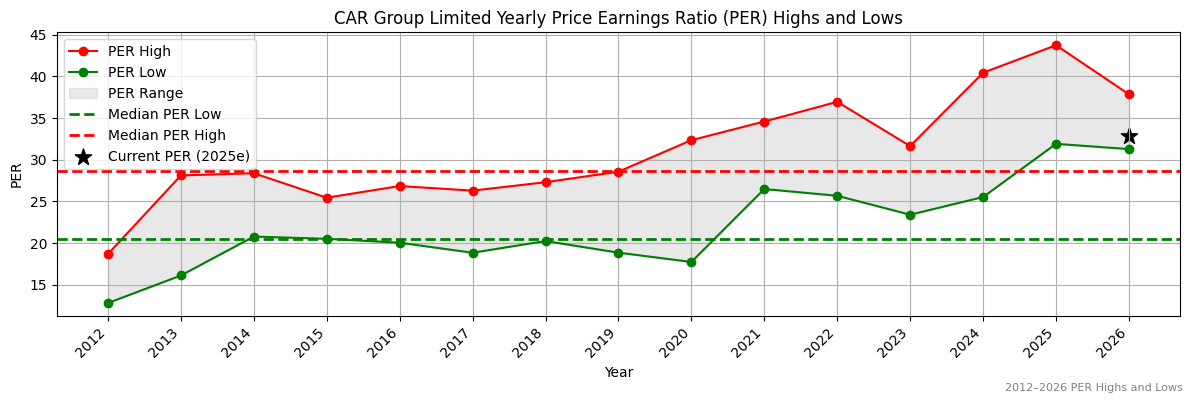
- High Relative Valuation
Income Statement
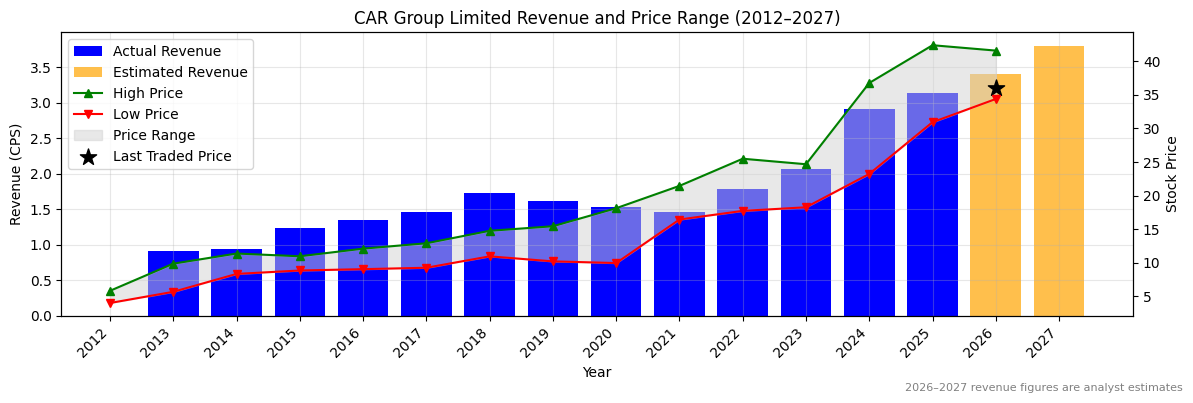
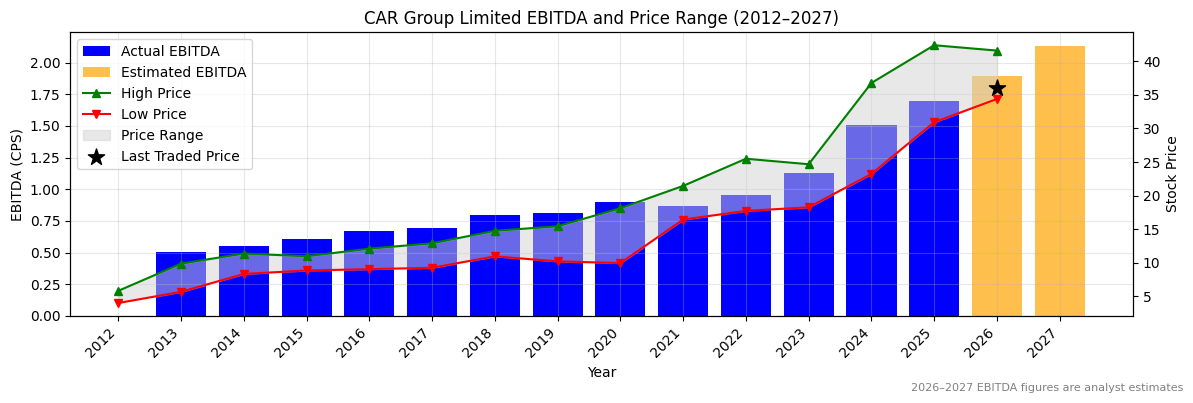
| Revenue 2024 Per Share | Revenue 2025e Per Share | Revenue 2026e Per Share | Revenue 24 to 25e [%] | Revenue 25e to 26e [%] | EBITDA 2024 Per Share | EBITDA 2025e Per Share | EBITDA 2026e Per Share | EBITDA 24 to 25e [%] | EBITDA 25e to 26e [%] |
|---|---|---|---|---|---|---|---|---|---|
| 2.91357 | 3.13855 | 3.41107 | 7.7 | 8.7 | 1.50583 | 1.69622 | 1.89526 | 12.6 | 11.7 |
CAR Revenue Per Share (2012–2027)
✅
✅
CAR Earnings before Interest, Tax, Depreciation and Amortisation (EBITDA) Per Share (2012–2027)
✅
✅
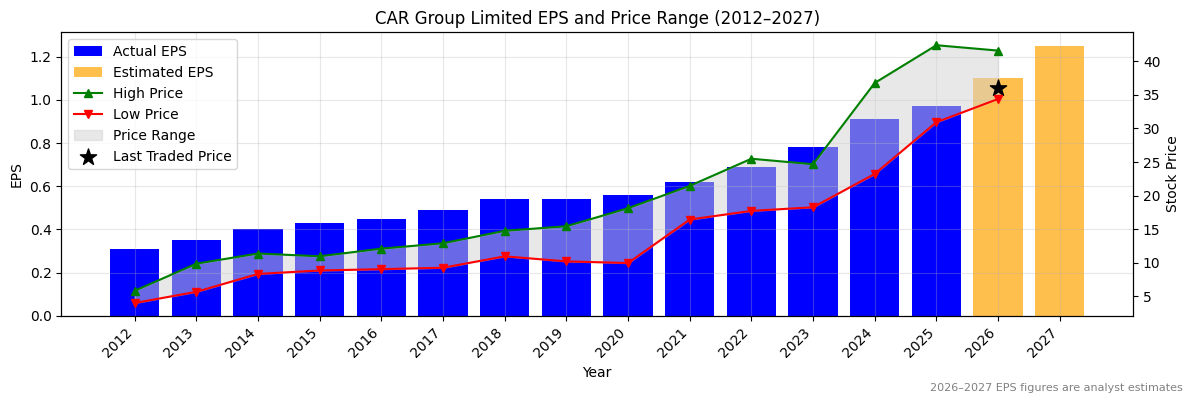
CAR Normalised Earnings Per Share (EPS) (2012–2027)
✅
✅
Valuation
| Price To Sales | Price To Book | PER 2023 | PER 2024 | 13Y Median PER Low | PER 2025e | 13Y Median PER High | PER 2026e | Last Updated |
|---|---|---|---|---|---|---|---|---|
| 11.4 | 4.5 | 45.8 | 39.2 | 20.5 | 36.8 | 28.6 | 32.5 | 26/10/25 |
CAR Yearly Price Earnings Ratio (PER) Highs and Lows
❌
❌
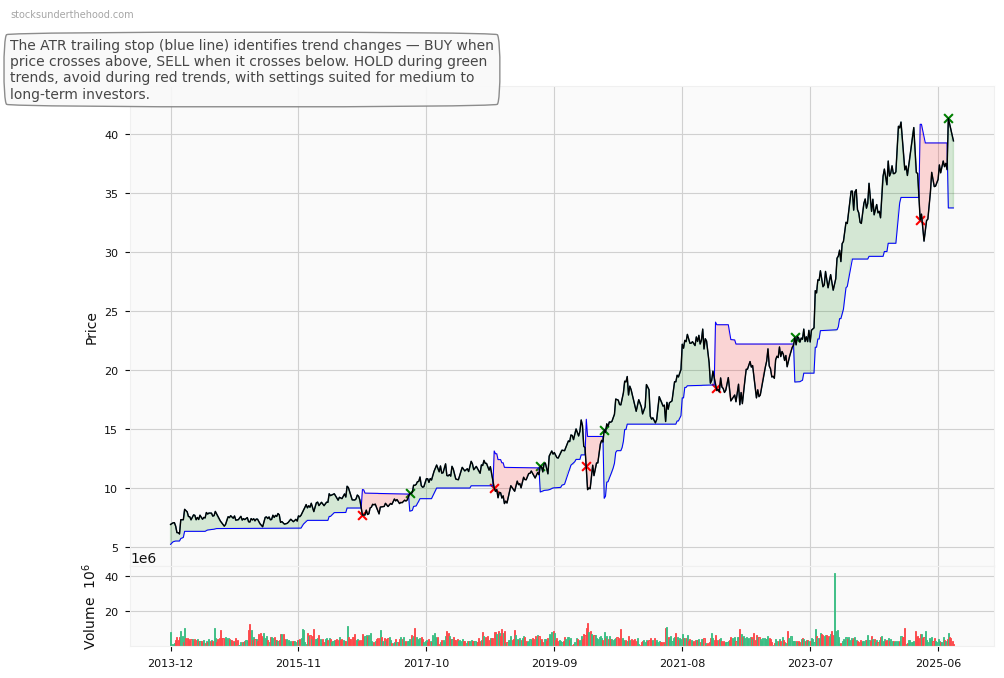
CAR Weekly Price Chart with Average True Range (ATR) Trailing Stop (10-Year View)