Centrepoint Alliance Limited (ASX:CAF) offers licensing, advice support, and funds management to financial advisers and clients in Australia. It serves through segments for mortgage broking, financial planning, and consulting for self-licensed advisers.
Ticker code: CAF
Sector: Financial Services | Industry: Asset Management | Website: https://www.centrepointalliance.com.au
Market Information
| Market Capitalisation | Enterprise Value | Shares Outstanding | Free Float [%] | Free Float Value |
|---|---|---|---|---|
| $72,619,067 | $64,236,067 | 207483052.0 | 55.46 | $40,274,178 |
Balance Sheet & Quality
| Equity | Cash | Debt | Return On Equity (ROE) | EBITDA 25 Margin [%] | Net Debt / Equity [%] | Rule of 40 |
|---|---|---|---|---|---|---|
| $35,064,637 | $13,741,000 | $5,358,000 | 0.0 | None | -23.9 | None |
Technicals & Short Data
| 3EMA Status | Volatility [%] | Value Traded Today | Average Daily Liquidity | Short [%] | Days To Cover |
|---|---|---|---|---|---|
| Negative | 5.6 | $61,500 | $32,817 | None | 0.0 |
Dividends
| Previous Dividend | Last Dividend | Franking [%] | Ex-Div Date | Gross Yield [%] |
|---|---|---|---|---|
| $0.013 | $0.018 | None | 2025-09-18 | 0.0 |
Price Performance Snapshot
| Last Traded Price | Change [%] | 1 Week [%] | 1 Month [%] | 3 Months [%] | 6 Months [%] | 12 Months [%] |
|---|---|---|---|---|---|---|
| $0.350 | None | None | -4.1 | -20.8 | -4.2 | 22.0 |
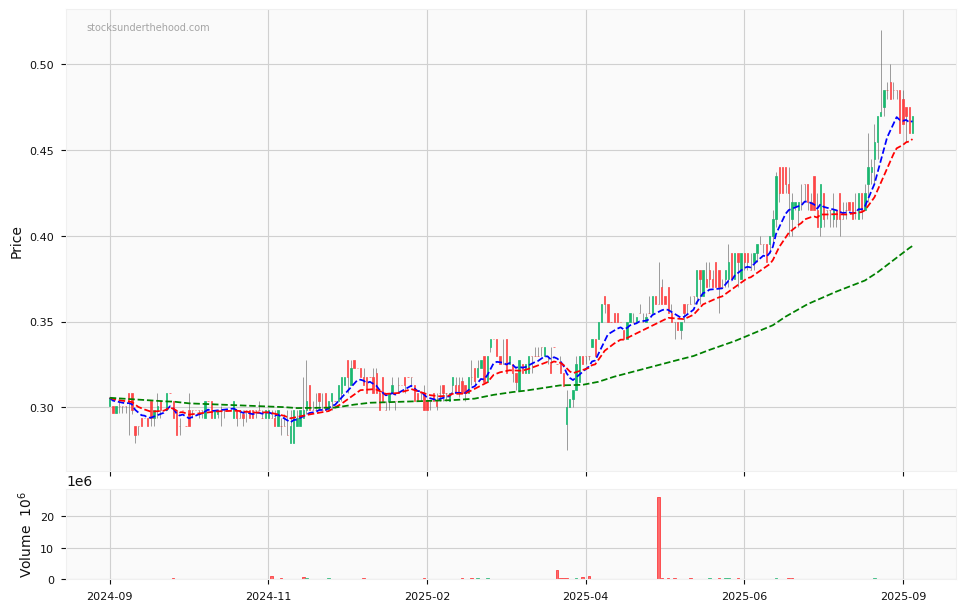
CAF Price Chart with Volume and 3EMA
CAF Short Positions
No chart available for this company.
Click HERE to understand why the above moving averages have been chosen.