Centuria Industrial REIT is a real estate investment trust investing in industrial properties across Australia, providing investors with exposure to the industrial property sector.
Ticker code: CIP
Sector: Real Estate | Industry: REIT – Industrial | Website: https://www.centuria.com.au/industrial-reit
Market Information
| Market Capitalisation | Enterprise Value | Shares Outstanding | Free Float [%] | Free Float Value |
|---|---|---|---|---|
| $2,106,134,914 | $3,465,718,866 | 624965871 | 84.31 | $1,775,771,843 |
Balance Sheet & Quality
| Equity | Cash | Debt | Return On Equity (ROE) | EBITDA 25 Margin [%] | Net Debt / Equity [%] | Rule of 40 |
|---|---|---|---|---|---|---|
| $2,447,991,263 | $15,038,000 | $1,374,621,952 | 4.7 | 86.9 | 55.5 | 53.2 |
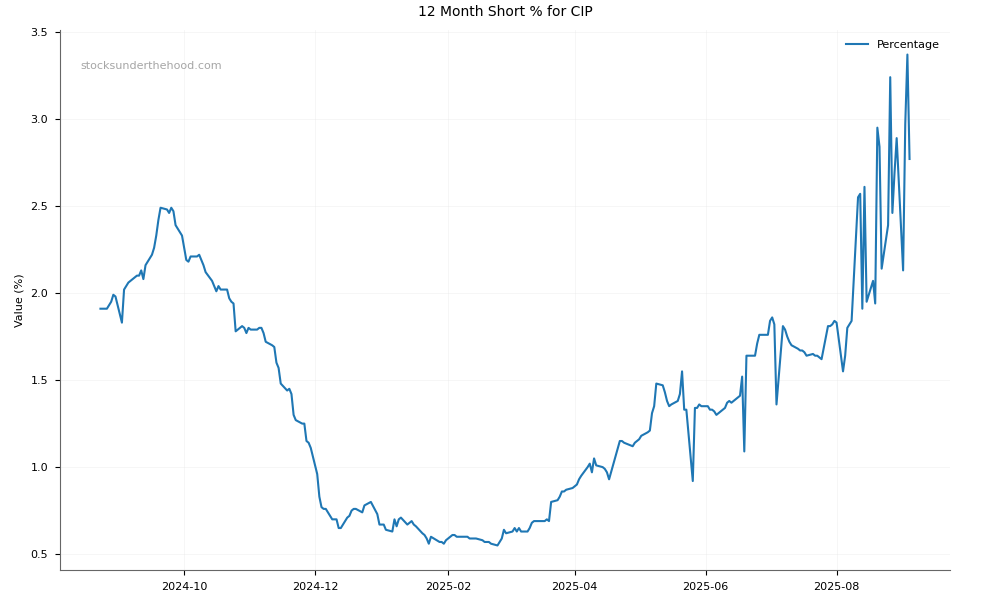
Technicals & Short Data
| 3EMA Status | Volatility [%] | Value Traded Today | Average Daily Liquidity | Short [%] | Days To Cover |
|---|---|---|---|---|---|
| Partial | 2.3 | $3,751,521 | $5,158,631 | 3.07 | 12.5 |
Dividends
| Previous Dividend | Last Dividend | Franking [%] | Ex-Div Date | Gross Yield [%] |
|---|---|---|---|---|
| $0.041 | $0.042 | None | 2025-09-29 | 2.5 |
Price Performance Snapshot
| Last Traded Price | Change [%] | 1 Week [%] | 1 Month [%] | 3 Months [%] | 6 Months [%] | 12 Months [%] |
|---|---|---|---|---|---|---|
| $3.370 | None | -2.6 | -4.3 | 2.1 | 10.0 | 24.2 |
CIP Price Chart with Volume and 3EMA

CIP Short Positions
Click HERE to understand why the above moving averages have been chosen.