Centuria Office REIT is a real estate investment trust focusing on investing in and managing office properties across key metropolitan markets in Australia.
Ticker code: COF
Sector: Real Estate | Industry: REIT – Office | Website: https://www.centuria.com.au
Market Information
| Market Capitalisation | Enterprise Value | Shares Outstanding | Free Float [%] | Free Float Value |
|---|---|---|---|---|
| $674,989,677 | $1,576,636,645 | 597336000 | 54.01 | $364,562,492 |
Balance Sheet & Quality
| Equity | Cash | Debt | Return On Equity (ROE) | EBITDA 25 Margin [%] | Net Debt / Equity [%] | Rule of 40 |
|---|---|---|---|---|---|---|
| $995,759,148 | $8,501,000 | $910,147,968 | 8.4 | None | 90.5 | None |
Technicals & Short Data
| 3EMA Status | Volatility [%] | Value Traded Today | Average Daily Liquidity | Short [%] | Days To Cover |
|---|---|---|---|---|---|
| Negative | 2.8 | $1,161,926 | $1,064,172 | 2.11 | 13.4 |
Dividends
| Previous Dividend | Last Dividend | Franking [%] | Ex-Div Date | Gross Yield [%] |
|---|---|---|---|---|
| $0.025 | $0.025 | None | 2025-09-29 | 4.5 |
Price Performance Snapshot
| Last Traded Price | Change [%] | 1 Week [%] | 1 Month [%] | 3 Months [%] | 6 Months [%] | 12 Months [%] |
|---|---|---|---|---|---|---|
| $1.130 | 1.3 | -3.8 | -3.8 | -6.9 | -2.5 | 10.5 |
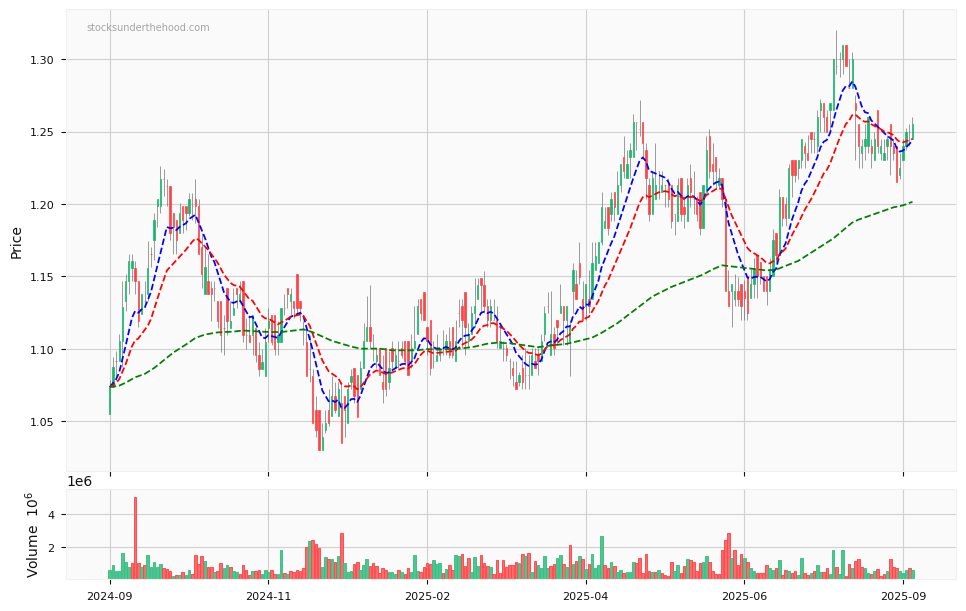
COF Price Chart with Volume and 3EMA
COF Short Positions

Click HERE to understand why the above moving averages have been chosen.