Chalice Mining Limited is a mineral exploration company focused on discovering and developing high-grade nickel, copper, and platinum group element deposits in Australia.
Ticker code: CHN
Sector: Basic Materials | Industry: Other Industrial Metals & Mining | Website: https://chalicemining.com
Market Information
| Market Capitalisation | Enterprise Value | Shares Outstanding | Free Float [%] | Free Float Value |
|---|---|---|---|---|
| $824,903,808 | $749,023,808 | 389105591 | 90.09 | $743,155,841 |
Balance Sheet & Quality
| Equity | Cash | Debt | Return On Equity (ROE) | EBITDA 25 Margin [%] | Net Debt / Equity [%] | Rule of 40 |
|---|---|---|---|---|---|---|
| $129,572,162 | $77,759,000 | $1,879,000 | -12.0 | None | -58.6 | None |
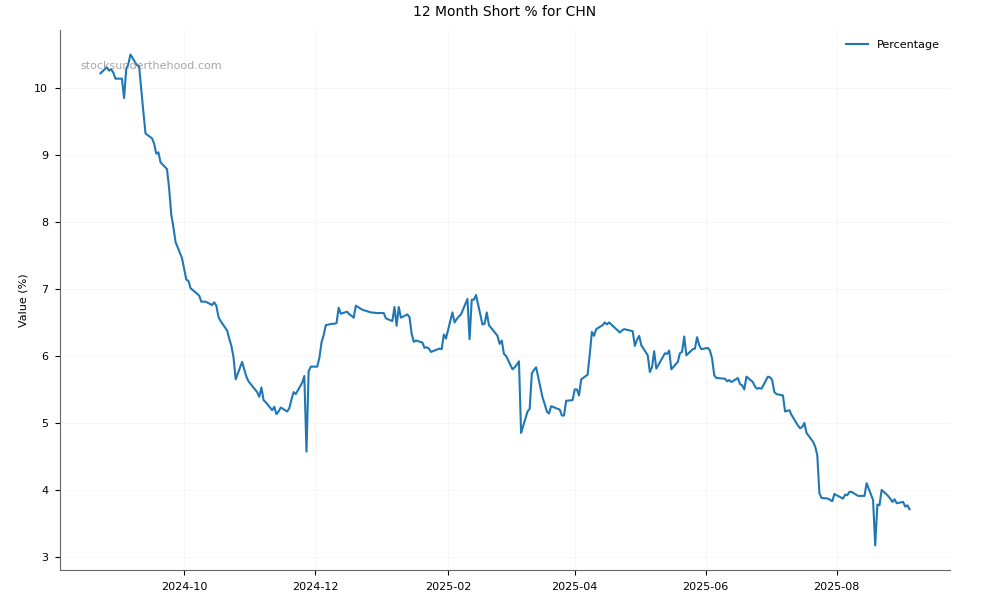
Technicals & Short Data
| 3EMA Status | Volatility [%] | Value Traded Today | Average Daily Liquidity | Short [%] | Days To Cover |
|---|---|---|---|---|---|
| Partial | 8.1 | $3,952,011 | $5,447,492 | 2.83 | 4.3 |
Dividends
| Previous Dividend | Last Dividend | Franking [%] | Ex-Div Date | Gross Yield [%] |
|---|---|---|---|---|
| None | None | None | None | 0.0 |
Price Performance Snapshot
| Last Traded Price | Change [%] | 1 Week [%] | 1 Month [%] | 3 Months [%] | 6 Months [%] | 12 Months [%] |
|---|---|---|---|---|---|---|
| $2.120 | 1.9 | -4.5 | -11.3 | 17.1 | 97.2 | 13.7 |
CHN Price Chart with Volume and 3EMA

CHN Short Positions
Click HERE to understand why the above moving averages have been chosen.