Charter Hall Long WALE REIT invests in high-quality real estate assets with long lease terms, providing stable income streams to investors through a diversified property portfolio.
Ticker code: CLW
Sector: Real Estate | Industry: REIT – Diversified | Website: https://www.charterhall.com.au
Market Information
| Market Capitalisation | Enterprise Value | Shares Outstanding | Free Float [%] | Free Float Value |
|---|---|---|---|---|
| $2,936,593,811 | $4,455,147,787 | 712765508 | 96.77 | $2,841,637,945 |
Balance Sheet & Quality
| Equity | Cash | Debt | Return On Equity (ROE) | EBITDA 25 Margin [%] | Net Debt / Equity [%] | Rule of 40 |
|---|---|---|---|---|---|---|
| $3,274,444,805 | $61,797,000 | $1,580,350,976 | 5.5 | 90.6 | 46.4 | 80.0 |
Technicals & Short Data
| 3EMA Status | Volatility [%] | Value Traded Today | Average Daily Liquidity | Short [%] | Days To Cover |
|---|---|---|---|---|---|
| Negative | 2.8 | $4,922,493 | $4,348,767 | 0.64 | 4.3 |
Dividends
| Previous Dividend | Last Dividend | Franking [%] | Ex-Div Date | Gross Yield [%] |
|---|---|---|---|---|
| $0.063 | $0.064 | None | 2025-09-29 | 3.1 |
Price Performance Snapshot
| Last Traded Price | Change [%] | 1 Week [%] | 1 Month [%] | 3 Months [%] | 6 Months [%] | 12 Months [%] |
|---|---|---|---|---|---|---|
| $4.120 | 0.5 | -0.5 | -3.5 | -7.9 | 0.8 | 15.7 |
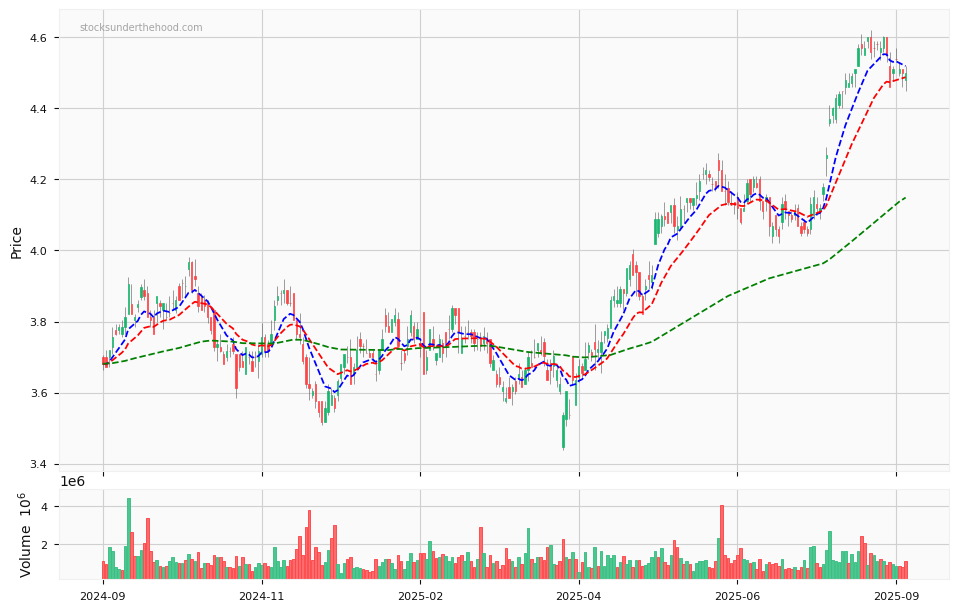
CLW Price Chart with Volume and 3EMA
CLW Short Positions

Click HERE to understand why the above moving averages have been chosen.