Civmec Limited provides construction and engineering services to the resources, energy, infrastructure, and marine sectors across Australia.
Ticker code: CVL
Sector: Industrials | Industry: Engineering & Construction | Website: https://www.civmec.com.au
Market Information
| Market Capitalisation | Enterprise Value | Shares Outstanding | Free Float [%] | Free Float Value |
|---|---|---|---|---|
| $696,683,362 | $714,254,362 | 508528000 | 50.64 | $352,765,621 |
Balance Sheet & Quality
| Equity | Cash | Debt | Return On Equity (ROE) | EBITDA 25 Margin [%] | Net Debt / Equity [%] | Rule of 40 |
|---|---|---|---|---|---|---|
| $530,903,249 | $102,940,000 | $120,511,000 | 8.6 | 10.4 | 3.3 | -3.7 |
Technicals & Short Data
| 3EMA Status | Volatility [%] | Value Traded Today | Average Daily Liquidity | Short [%] | Days To Cover |
|---|---|---|---|---|---|
| Partial | 3.3 | $89,962 | $363,086 | None | 0.0 |
Dividends
| Previous Dividend | Last Dividend | Franking [%] | Ex-Div Date | Gross Yield [%] |
|---|---|---|---|---|
| $0.025 | $0.035 | None | 2025-10-13 | 2.6 |
Price Performance Snapshot
| Last Traded Price | Change [%] | 1 Week [%] | 1 Month [%] | 3 Months [%] | 6 Months [%] | 12 Months [%] |
|---|---|---|---|---|---|---|
| $1.370 | -0.4 | -2.1 | -0.4 | 10.1 | 35.0 | 7.2 |
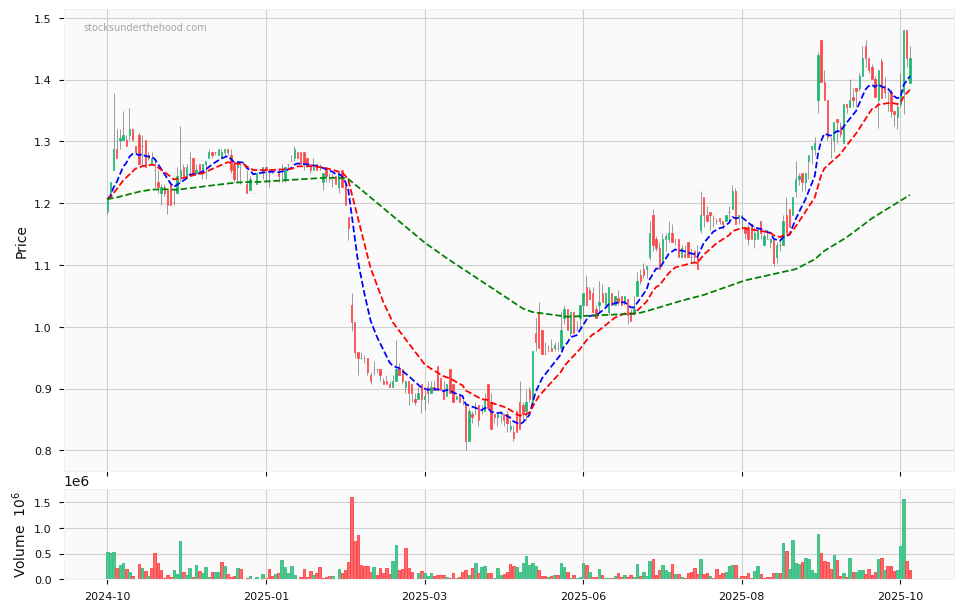
CVL Price Chart with Volume and 3EMA
CVL Short Positions
No chart available for this company.
Click HERE to understand why the above moving averages have been chosen.