ClearVue Technologies Limited specializes in the development of advanced glazing technologies that generate electricity from solar energy while maintaining transparency.
Ticker code: CVW
Sector: Financial Services | Industry: Insurance – Life | Website: https://www.clearview.com.au
Market Information
| Market Capitalisation | Enterprise Value | Shares Outstanding | Free Float [%] | Free Float Value |
|---|---|---|---|---|
| $379,373,827 | $360,775,811 | 637603040 | 57.57 | $218,395,303 |
Balance Sheet & Quality
| Equity | Cash | Debt | Return On Equity (ROE) | EBITDA 25 Margin [%] | Net Debt / Equity [%] | Rule of 40 |
|---|---|---|---|---|---|---|
| $348,131,273 | $213,139,008 | $194,540,992 | 13.3 | None | -5.3 | None |
Technicals & Short Data
| 3EMA Status | Volatility [%] | Value Traded Today | Average Daily Liquidity | Short [%] | Days To Cover |
|---|---|---|---|---|---|
| Positive | 3.7 | $170,087 | $419,696 | 0.0 | 0.0 |
Dividends
| Previous Dividend | Last Dividend | Franking [%] | Ex-Div Date | Gross Yield [%] |
|---|---|---|---|---|
| None | None | 100.0 | 2024-09-04 | 0.0 |
Price Performance Snapshot
| Last Traded Price | Change [%] | 1 Week [%] | 1 Month [%] | 3 Months [%] | 6 Months [%] | 12 Months [%] |
|---|---|---|---|---|---|---|
| $0.595 | None | 5.3 | 2.6 | 26.6 | 28.0 | 14.4 |
CVW Price Chart with Volume and 3EMA
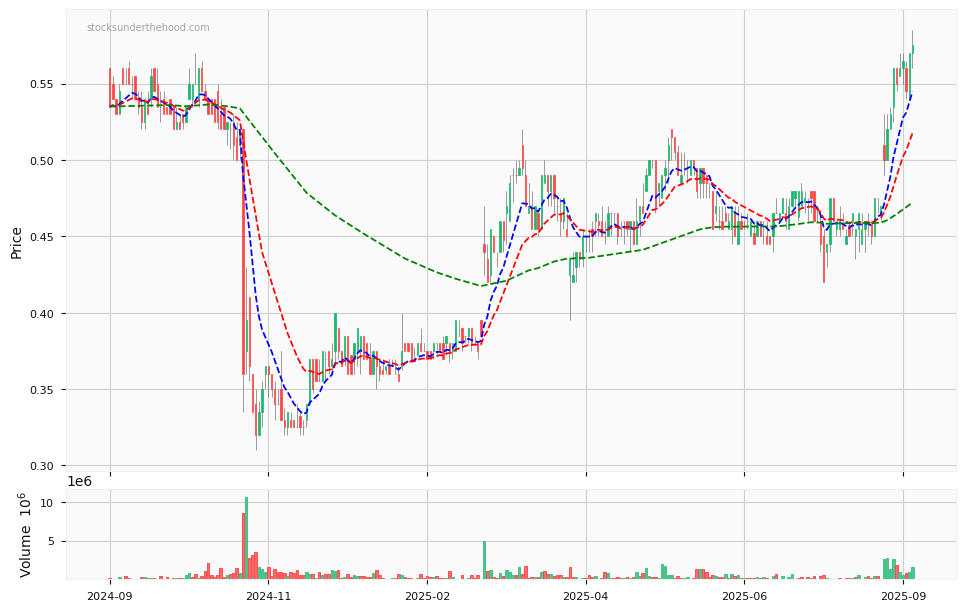
CVW Short Positions

Click HERE to understand why the above moving averages have been chosen.