Clinuvel Pharmaceuticals Limited is a biopharmaceutical company focused on developing treatments for severe skin disorders and related conditions.
Ticker code: CUV
Sector: Healthcare | Industry: Biotechnology | Website: https://www.clinuvel.com
Market Information
| Market Capitalisation | Enterprise Value | Shares Outstanding | Free Float [%] | Free Float Value |
|---|---|---|---|---|
| $652,107,601 | $428,530,193 | 50200740 | 82.67 | $539,076,651 |
Balance Sheet & Quality
| Equity | Cash | Debt | Return On Equity (ROE) | EBITDA 25 Margin [%] | Net Debt / Equity [%] | Rule of 40 |
|---|---|---|---|---|---|---|
| $241,164,348 | $224,105,936 | $528,528 | 15.0 | 49.4 | -92.7 | 67.2 |
Technicals & Short Data
| 3EMA Status | Volatility [%] | Value Traded Today | Average Daily Liquidity | Short [%] | Days To Cover |
|---|---|---|---|---|---|
| Positive | 6.0 | $1,471,338 | $1,597,056 | 9.53 | 38.9 |
Dividends
| Previous Dividend | Last Dividend | Franking [%] | Ex-Div Date | Gross Yield [%] |
|---|---|---|---|---|
| $0.050 | $0.050 | 100.0 | 2025-09-04 | 0.0 |
Price Performance Snapshot
| Last Traded Price | Change [%] | 1 Week [%] | 1 Month [%] | 3 Months [%] | 6 Months [%] | 12 Months [%] |
|---|---|---|---|---|---|---|
| $12.990 | 2.3 | 9.1 | 17.9 | 15.2 | 26.7 | 2.5 |
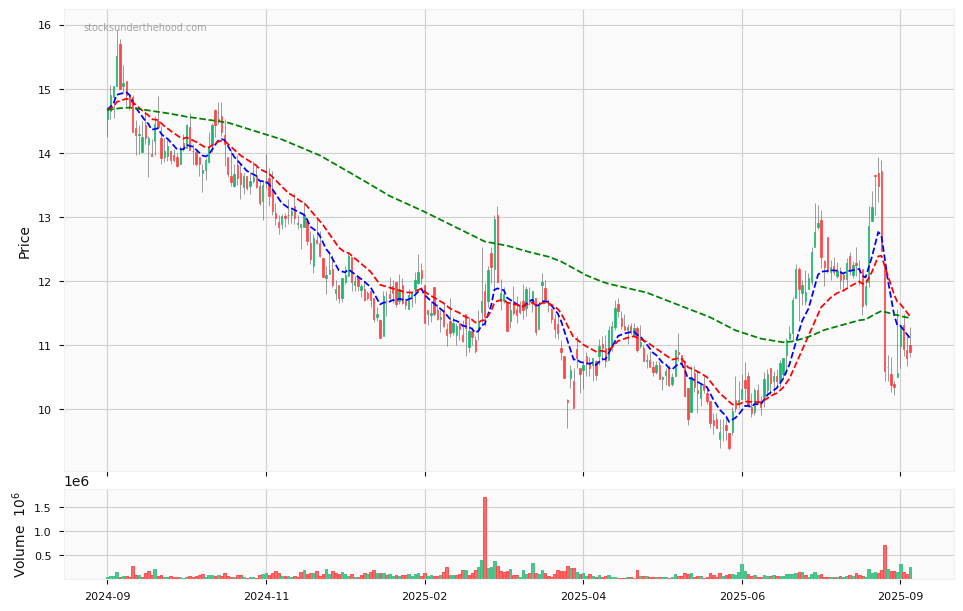
CUV Price Chart with Volume and 3EMA
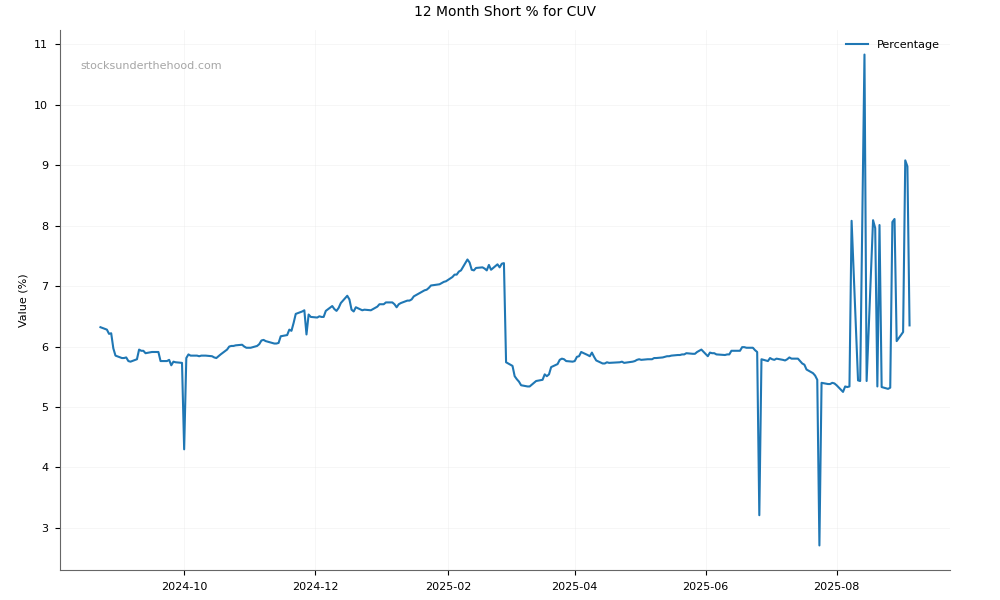
CUV Short Positions
Click HERE to understand why the above moving averages have been chosen.