Cochlear Limited designs, manufactures, and supplies implantable hearing solutions, helping people with hearing loss in over 100 countries.
Ticker code: COH
Sector: Healthcare | Industry: Medical Devices | Website: https://www.cochlear.com
Market Information
| Market Capitalisation | Enterprise Value | Shares Outstanding | Free Float [%] | Free Float Value |
|---|---|---|---|---|
| $18,979,264,752 | $18,939,264,752 | 65398385 | 99.6 | $18,902,758,723 |
Balance Sheet & Quality
| Equity | Cash | Debt | Return On Equity (ROE) | EBITDA 25 Margin [%] | Net Debt / Equity [%] | Rule of 40 |
|---|---|---|---|---|---|---|
| $1,950,310,649 | $275,700,000 | $235,700,000 | 20.0 | 25.8 | -2.1 | 31.5 |
Technicals & Short Data
| 3EMA Status | Volatility [%] | Value Traded Today | Average Daily Liquidity | Short [%] | Days To Cover |
|---|---|---|---|---|---|
| Partial | 1.7 | $22,171,753 | $39,405,293 | 2.82 | 13.6 |
Dividends
| Previous Dividend | Last Dividend | Franking [%] | Ex-Div Date | Gross Yield [%] |
|---|---|---|---|---|
| $2.150 | $2.150 | 75.0 | 2025-09-18 | 1.0 |
Price Performance Snapshot
| Last Traded Price | Change [%] | 1 Week [%] | 1 Month [%] | 3 Months [%] | 6 Months [%] | 12 Months [%] |
|---|---|---|---|---|---|---|
| $290.210 | -0.4 | 1.1 | 3.6 | -6.6 | 8.9 | 3.7 |
COH Price Chart with Volume and 3EMA

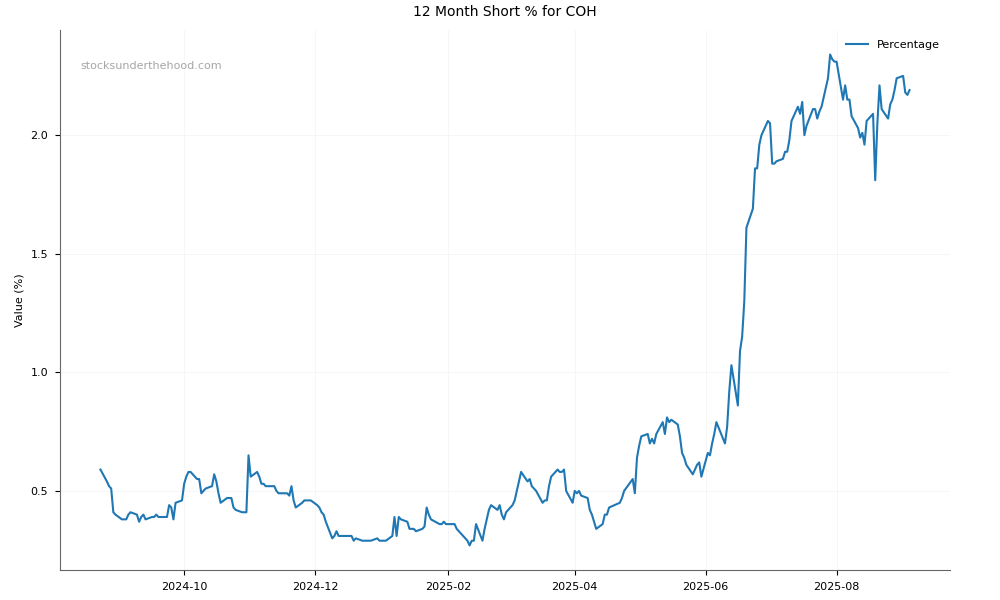
COH Short Positions
Click HERE to understand why the above moving averages have been chosen.