Collins Foods Limited operates quick-service restaurants, including KFC and Taco Bell franchises, across Australia and parts of Europe, focusing on the fast-food industry.
Ticker code: CKF
Sector: Consumer Cyclical | Industry: Restaurants | Website: https://www.collinsfoods.com
Market Information
| Market Capitalisation | Enterprise Value | Shares Outstanding | Free Float [%] | Free Float Value |
|---|---|---|---|---|
| $1,253,364,283 | $2,034,501,259 | 118019237 | 90.42 | $1,133,354,653 |
Balance Sheet & Quality
| Equity | Cash | Debt | Return On Equity (ROE) | EBITDA 25 Margin [%] | Net Debt / Equity [%] | Rule of 40 |
|---|---|---|---|---|---|---|
| $417,198,024 | $101,614,000 | $882,750,976 | 11.0 | 14.5 | 187.2 | 18.2 |
Technicals & Short Data
| 3EMA Status | Volatility [%] | Value Traded Today | Average Daily Liquidity | Short [%] | Days To Cover |
|---|---|---|---|---|---|
| Partial | 6.5 | $18,726,044 | $3,714,759 | 1.31 | 4.4 |
Dividends
| Previous Dividend | Last Dividend | Franking [%] | Ex-Div Date | Gross Yield [%] |
|---|---|---|---|---|
| $0.150 | $0.130 | 100.0 | 2025-12-05 | 3.8 |
Price Performance Snapshot
| Last Traded Price | Change [%] | 1 Week [%] | 1 Month [%] | 3 Months [%] | 6 Months [%] | 12 Months [%] |
|---|---|---|---|---|---|---|
| $10.620 | 4.4 | -4.0 | -2.1 | 3.6 | 43.3 | 38.7 |
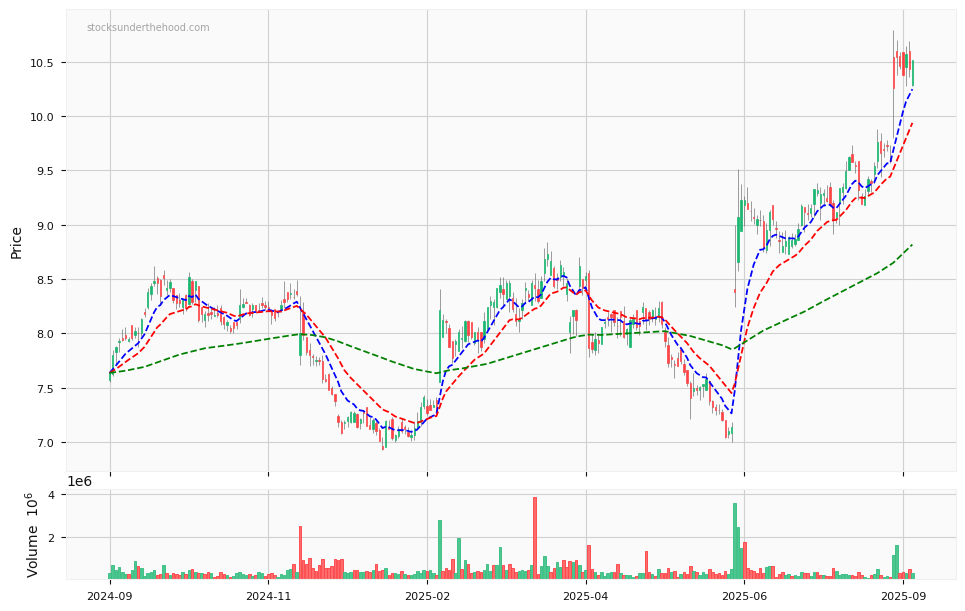
CKF Price Chart with Volume and 3EMA
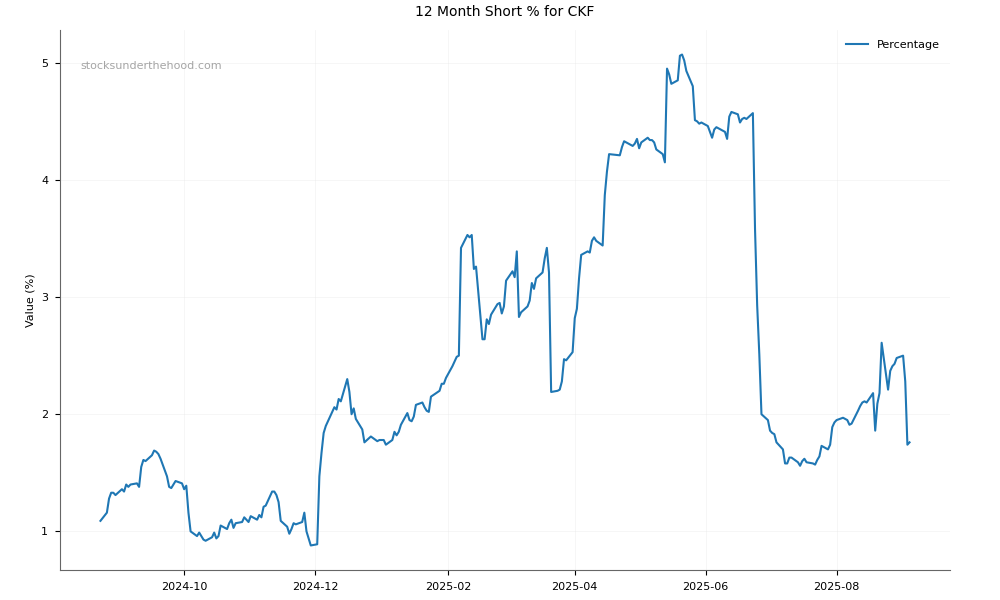
CKF Short Positions
Click HERE to understand why the above moving averages have been chosen.