Commonwealth Bank of Australia is a leading Australian bank offering a comprehensive range of financial services, including retail, business, and institutional banking.
Ticker code: CBA
Sector: Financial Services | Industry: Banks – Diversified | Website: https://www.commbank.com.au
Market Information
| Market Capitalisation | Enterprise Value | Shares Outstanding | Free Float [%] | Free Float Value |
|---|---|---|---|---|
| $284,831,738,251 | $395,595,753,867 | 1671842146 | 99.84 | $284,367,462,466 |
Balance Sheet & Quality
| Equity | Cash | Debt | Return On Equity (ROE) | EBITDA 25 Margin [%] | Net Debt / Equity [%] | Rule of 40 |
|---|---|---|---|---|---|---|
| $78,775,527,251 | $204,856,999,936 | $315,621,015,552 | 13.1 | 54.9 | 140.6 | 60.0 |
Technicals & Short Data
| 3EMA Status | Volatility [%] | Value Traded Today | Average Daily Liquidity | Short [%] | Days To Cover |
|---|---|---|---|---|---|
| Positive | 1.7 | $220,174,085 | $311,072,270 | 0.67 | 6.1 |
Dividends
| Previous Dividend | Last Dividend | Franking [%] | Ex-Div Date | Gross Yield [%] |
|---|---|---|---|---|
| $2.250 | $2.600 | 100.0 | 2025-08-20 | 2.2 |
Price Performance Snapshot
| Last Traded Price | Change [%] | 1 Week [%] | 1 Month [%] | 3 Months [%] | 6 Months [%] | 12 Months [%] |
|---|---|---|---|---|---|---|
| $170.370 | -0.8 | -1.3 | 3.3 | 0.1 | 6.2 | 22.7 |
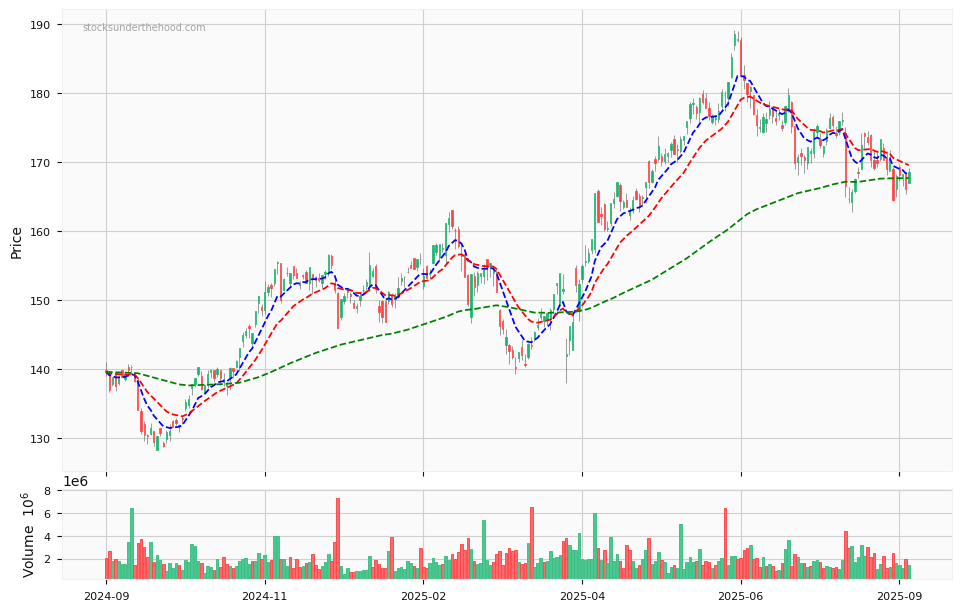
CBA Price Chart with Volume and 3EMA
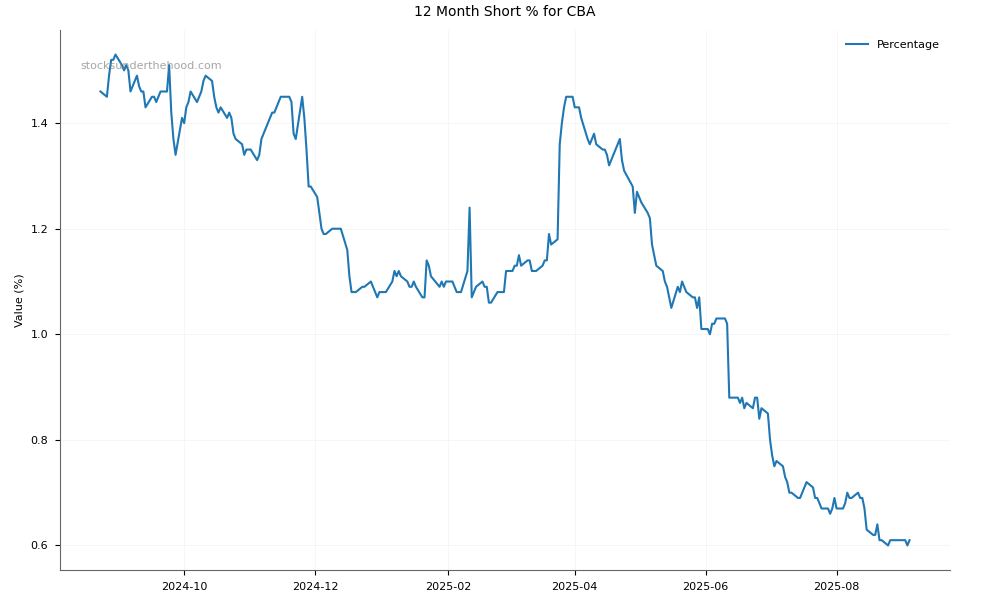
CBA Short Positions
Click HERE to understand why the above moving averages have been chosen.