Computershare Limited is a global market leader in transfer agency and share registration, employee equity plans, mortgage servicing, proxy solicitation, and stakeholder communications.
Ticker code: CPU
Sector: Financial Services | Industry: Capital Markets | Website: https://www.computershare.com
Market Information
| Market Capitalisation | Enterprise Value | Shares Outstanding | Free Float [%] | Free Float Value |
|---|---|---|---|---|
| $20,174,141,619 | $21,066,871,731 | 578387070 | 95.92 | $19,350,834,911 |
Balance Sheet & Quality
| Equity | Cash | Debt | Return On Equity (ROE) | EBITDA 25 Margin [%] | Net Debt / Equity [%] | Rule of 40 |
|---|---|---|---|---|---|---|
| $2,152,178,179 | $1,255,668,992 | $2,148,399,104 | 34.9 | 39.2 | 41.5 | 30.2 |
Technicals & Short Data
| 3EMA Status | Volatility [%] | Value Traded Today | Average Daily Liquidity | Short [%] | Days To Cover |
|---|---|---|---|---|---|
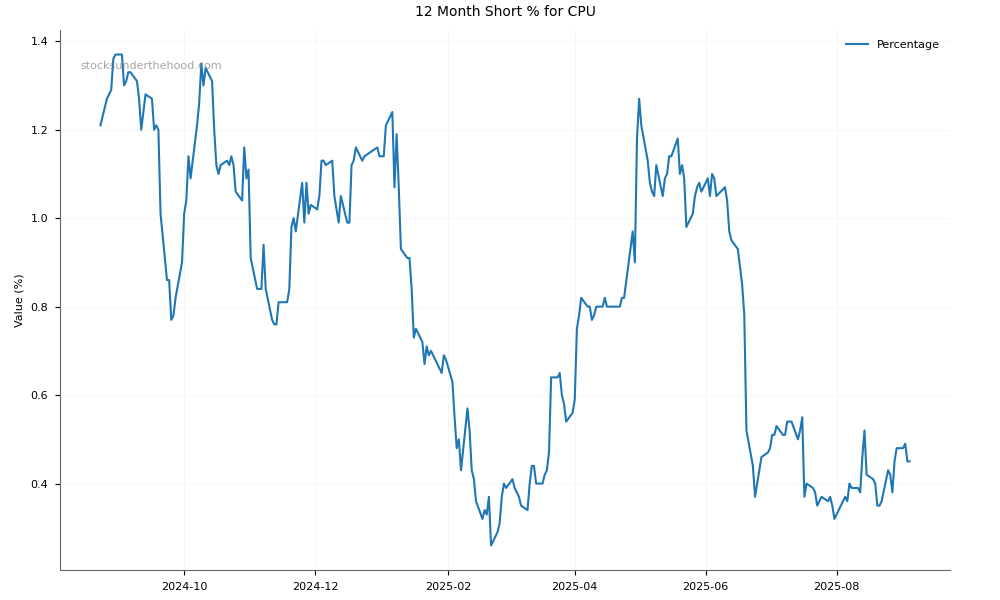
| Negative | 2.9 | $209,348,511 | $40,409,353 | 0.24 | 1.2 |
Dividends
| Previous Dividend | Last Dividend | Franking [%] | Ex-Div Date | Gross Yield [%] |
|---|---|---|---|---|
| $0.450 | $0.480 | 20.0 | 2025-08-19 | 1.5 |
Price Performance Snapshot
| Last Traded Price | Change [%] | 1 Week [%] | 1 Month [%] | 3 Months [%] | 6 Months [%] | 12 Months [%] |
|---|---|---|---|---|---|---|
| $34.880 | -0.1 | -2.1 | -0.5 | -6.9 | -14.1 | 7.5 |
CPU Price Chart with Volume and 3EMA

CPU Short Positions
Click HERE to understand why the above moving averages have been chosen.