Ticker code: CEN
CEN Red Flags & Risk Indicators
⚠️
⚠️
⚠️ RED FLAGS: 2 identified
- Falling Earnings
- High Relative Valuation
Income Statement
| Revenue 2024 Per Share | Revenue 2025e Per Share | Revenue 2026e Per Share | Revenue 24 to 25e [%] | Revenue 25e to 26e [%] | EBITDA 2024 Per Share | EBITDA 2025e Per Share | EBITDA 2026e Per Share | EBITDA 24 to 25e [%] | EBITDA 25e to 26e [%] |
|---|---|---|---|---|---|---|---|---|---|
| 3.5221 | 3.1393 | 2.9474 | -10.9 | -6.1 | 0.84373 | 0.9673 | 0.87033 | 14.6 | -10.0 |
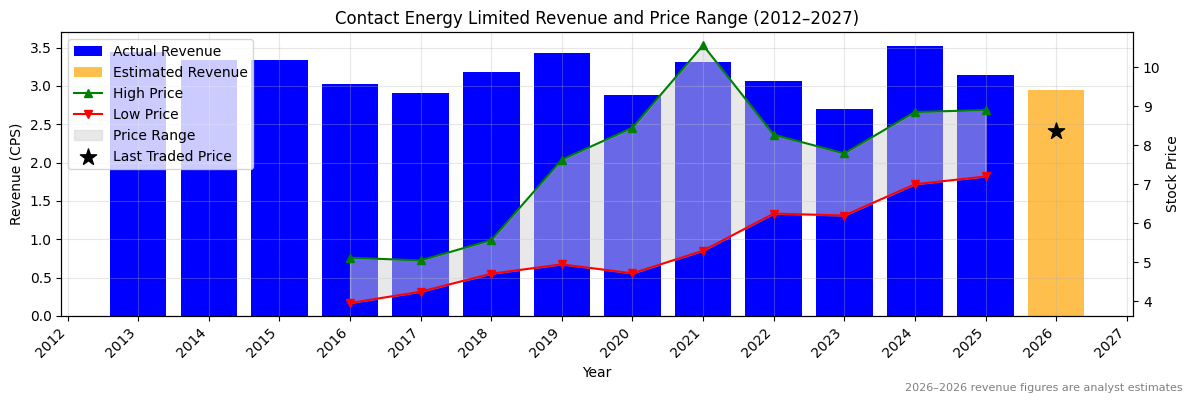
CEN Revenue Per Share (2012–2027)
❌
❌
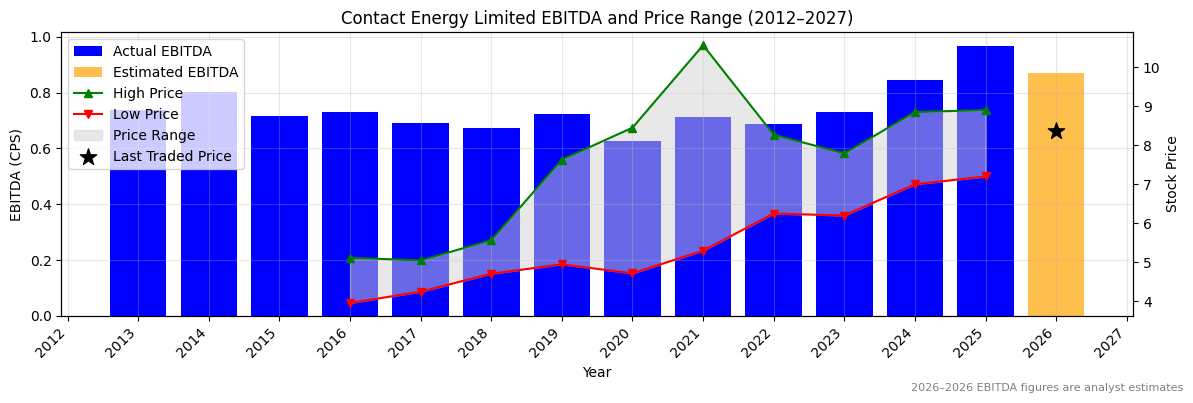
CEN Earnings before Interest, Tax, Depreciation and Amortisation (EBITDA) Per Share (2012–2027)
✅
✅
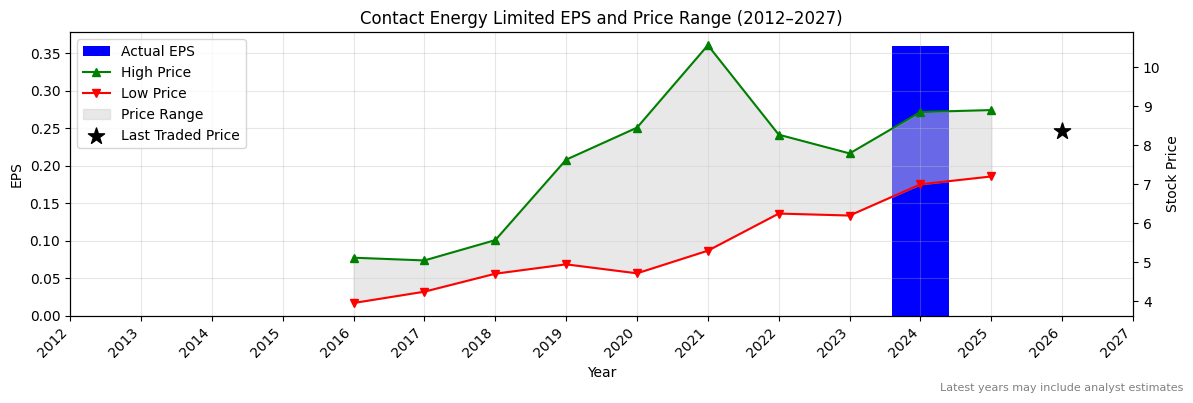
CEN Normalised Earnings Per Share (EPS) (2012–2027)
Valuation
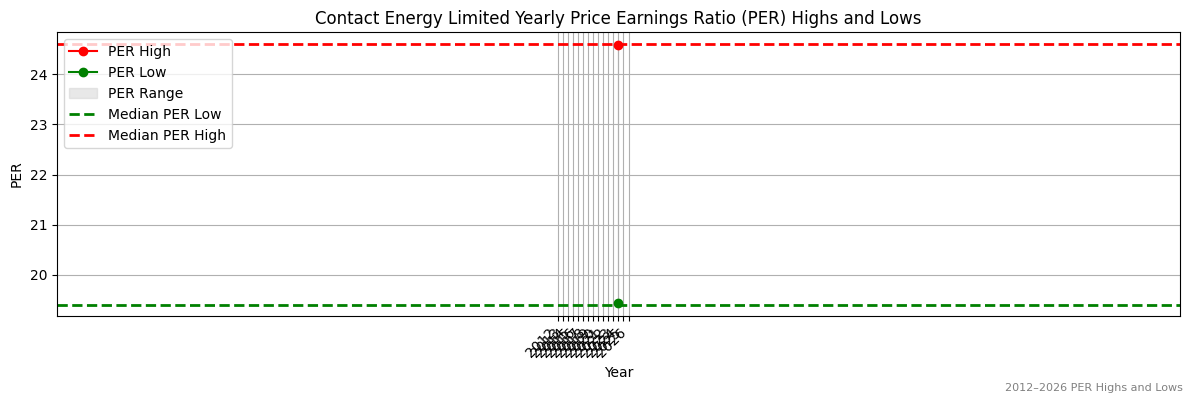
| Price To Sales | Price To Book | PER 2023 | PER 2024 | 13Y Median PER Low | PER 2025e | 13Y Median PER High | PER 2026e | Last Updated |
|---|---|---|---|---|---|---|---|---|
| 2.4 | 2.5 | None | 22.9 | 18.9 | None | 23.9 | None | 29/7/24 |
CEN Yearly Price Earnings Ratio (PER) Highs and Lows
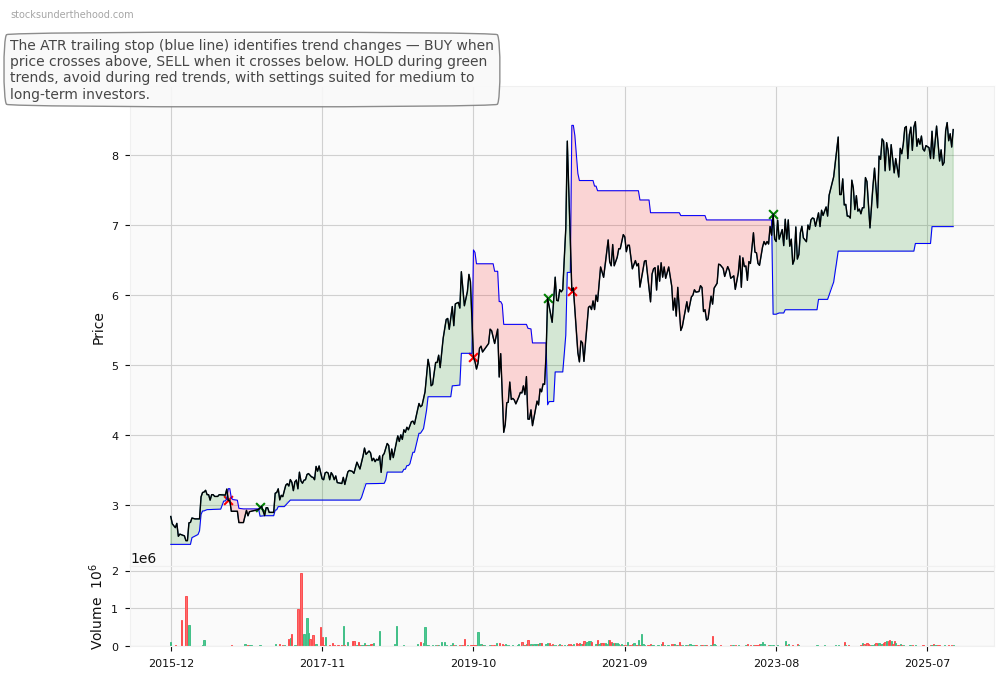
CEN Weekly Price Chart with Average True Range (ATR) Trailing Stop (10-Year View)
We are exploring long-term business collaborations and found your company of interest. May we kindly request your product catalog and pricing? You may contact me via WhatsApp: +44 790 462 9452
We are exploring long-term business collaborations and found your company of interest. May we kindly request your product catalog and pricing? You may contact me via WhatsApp: +44 7404 788 963