Credit Corp Group Limited is a debt collection agency specializing in purchasing and collecting overdue debts, as well as providing consumer lending services.
Ticker code: CCP
Sector: Financial Services | Industry: Credit Services | Website: https://www.creditcorpgroup.com.au
Market Information
| Market Capitalisation | Enterprise Value | Shares Outstanding | Free Float [%] | Free Float Value |
|---|---|---|---|---|
| $967,230,026 | $1,334,945,034 | 68066856 | 97.55 | $943,484,534 |
Balance Sheet & Quality
| Equity | Cash | Debt | Return On Equity (ROE) | EBITDA 25 Margin [%] | Net Debt / Equity [%] | Rule of 40 |
|---|---|---|---|---|---|---|
| $890,246,495 | $56,712,000 | $424,427,008 | 10.6 | 32.7 | 41.3 | 46.7 |
Technicals & Short Data
| 3EMA Status | Volatility [%] | Value Traded Today | Average Daily Liquidity | Short [%] | Days To Cover |
|---|---|---|---|---|---|
| Partial | 5.8 | $2,095,122 | $3,676,496 | 0.52 | 1.4 |
Dividends
| Previous Dividend | Last Dividend | Franking [%] | Ex-Div Date | Gross Yield [%] |
|---|---|---|---|---|
| $0.320 | $0.360 | 100.0 | 2025-09-15 | 3.6 |
Price Performance Snapshot
| Last Traded Price | Change [%] | 1 Week [%] | 1 Month [%] | 3 Months [%] | 6 Months [%] | 12 Months [%] |
|---|---|---|---|---|---|---|
| $14.210 | 0.1 | 3.3 | 1.9 | -11.4 | 7.9 | -10.7 |
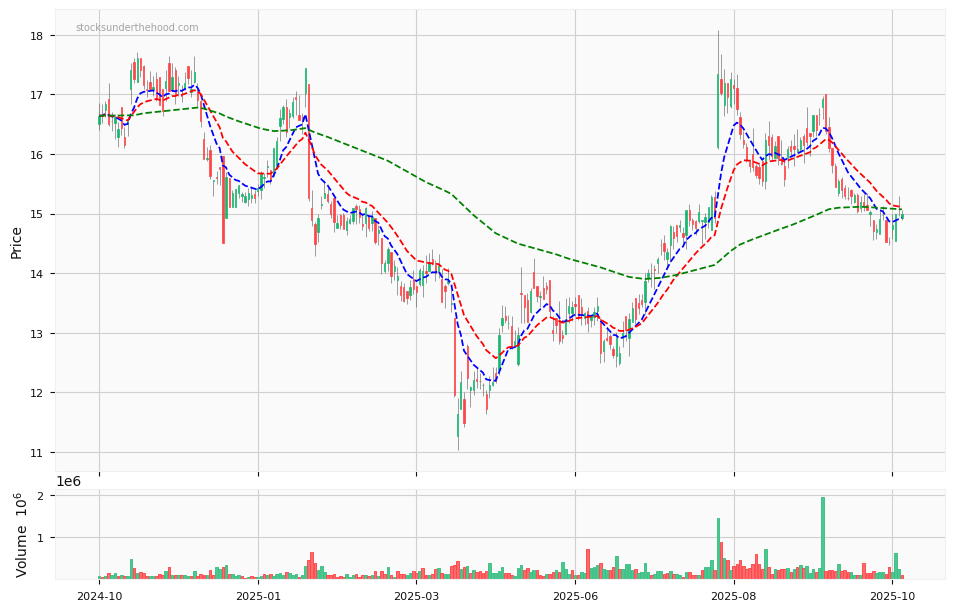
CCP Price Chart with Volume and 3EMA
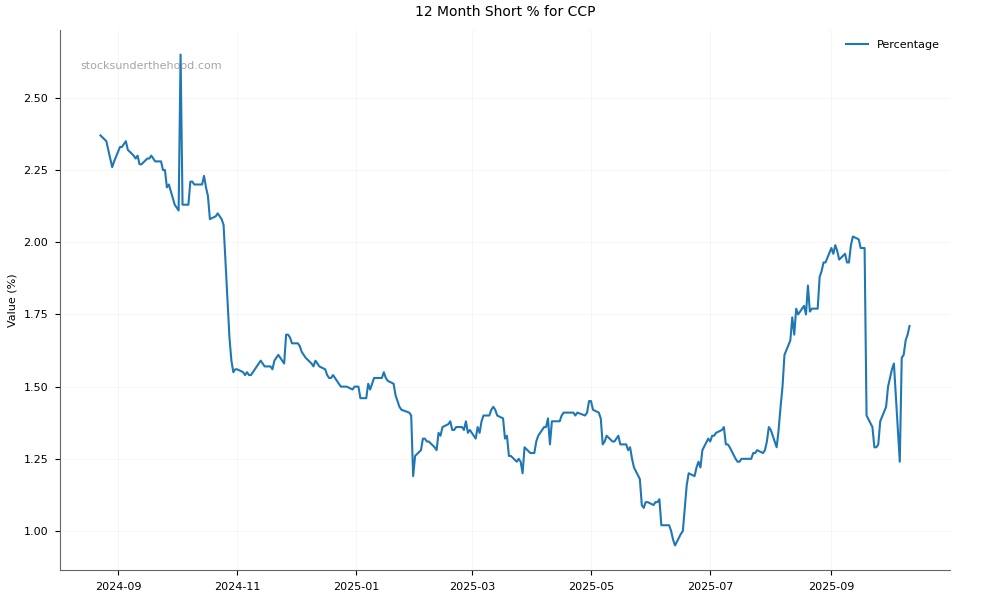
CCP Short Positions
Click HERE to understand why the above moving averages have been chosen.