Cromwell Property Group is a real estate investment and funds management company, owning and managing a diversified portfolio of commercial properties in Australia and Europe.
Ticker code: CMW
Sector: Real Estate | Industry: REIT – Office | Website: https://www.cromwell.com.au
Market Information
| Market Capitalisation | Enterprise Value | Shares Outstanding | Free Float [%] | Free Float Value |
|---|---|---|---|---|
| $1,230,867,345 | $1,826,367,377 | 2618866699 | 80.4 | $989,568,111 |
Balance Sheet & Quality
| Equity | Cash | Debt | Return On Equity (ROE) | EBITDA 25 Margin [%] | Net Debt / Equity [%] | Rule of 40 |
|---|---|---|---|---|---|---|
| $1,453,471,095 | $82,400,000 | $677,900,032 | 7.2 | None | 41.0 | None |
Technicals & Short Data
| 3EMA Status | Volatility [%] | Value Traded Today | Average Daily Liquidity | Short [%] | Days To Cover |
|---|---|---|---|---|---|
| Partial | 3.2 | $1,788,597 | $1,976,757 | 0.48 | 3.0 |
Dividends
| Previous Dividend | Last Dividend | Franking [%] | Ex-Div Date | Gross Yield [%] |
|---|---|---|---|---|
| $0.008 | $0.008 | None | 2025-09-29 | 3.2 |
Price Performance Snapshot
| Last Traded Price | Change [%] | 1 Week [%] | 1 Month [%] | 3 Months [%] | 6 Months [%] | 12 Months [%] |
|---|---|---|---|---|---|---|
| $0.470 | 1.1 | 3.3 | 1.6 | 19.4 | 30.2 | 23.8 |
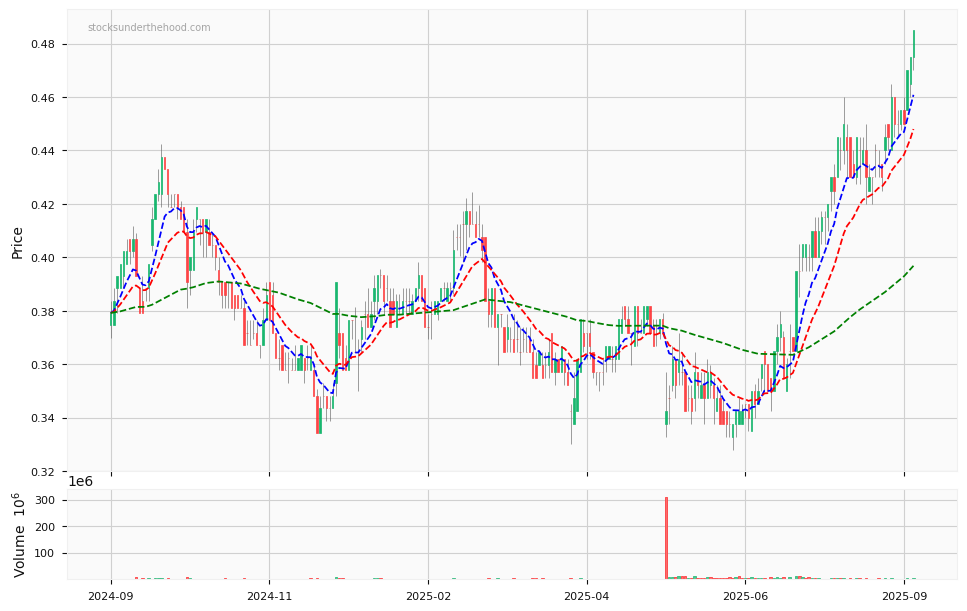
CMW Price Chart with Volume and 3EMA
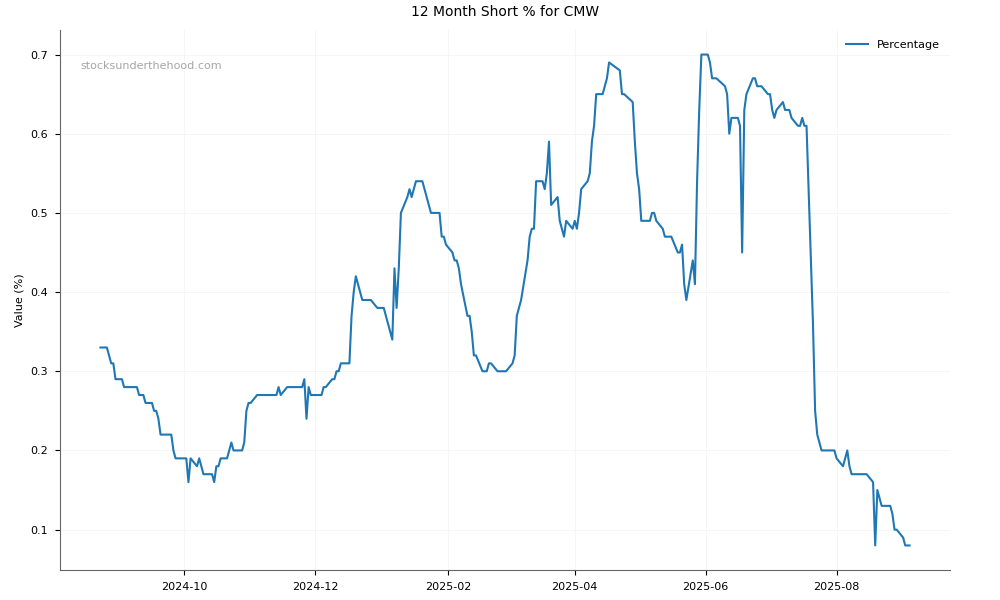
CMW Short Positions
Click HERE to understand why the above moving averages have been chosen.