CSL Limited is a global biotechnology company that develops and delivers innovative biotherapies and influenza vaccines, improving the health of people worldwide.
Ticker code: CSL
Sector: Healthcare | Industry: Biotechnology | Website: https://www.csl.com
Market Information
| Market Capitalisation | Enterprise Value | Shares Outstanding | Free Float [%] | Free Float Value |
|---|---|---|---|---|
| $88,210,230,010 | $97,551,230,458 | 485151394 | 99.74 | $87,983,106,457 |
Balance Sheet & Quality
| Equity | Cash | Debt | Return On Equity (ROE) | EBITDA 25 Margin [%] | Net Debt / Equity [%] | Rule of 40 |
|---|---|---|---|---|---|---|
| $19,372,580,399 | $2,156,999,936 | $11,498,000,384 | 16.5 | 33.1 | 48.2 | 37.1 |
Technicals & Short Data
| 3EMA Status | Volatility [%] | Value Traded Today | Average Daily Liquidity | Short [%] | Days To Cover |
|---|---|---|---|---|---|
| Negative | 3.7 | $156,391,388 | $212,110,493 | 0.37 | 1.5 |
Dividends
| Previous Dividend | Last Dividend | Franking [%] | Ex-Div Date | Gross Yield [%] |
|---|---|---|---|---|
| $2.073 | $2.451 | 5.0 | 2025-09-09 | 1.4 |
Price Performance Snapshot
| Last Traded Price | Change [%] | 1 Week [%] | 1 Month [%] | 3 Months [%] | 6 Months [%] | 12 Months [%] |
|---|---|---|---|---|---|---|
| $181.820 | -2.0 | -0.9 | 1.6 | -12.1 | -24.0 | -34.3 |
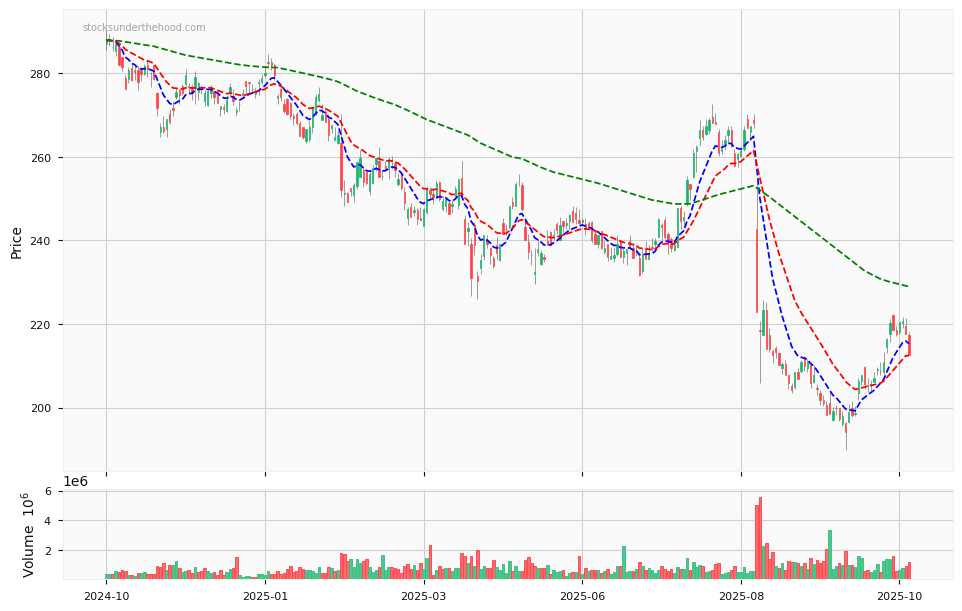
CSL Price Chart with Volume and 3EMA
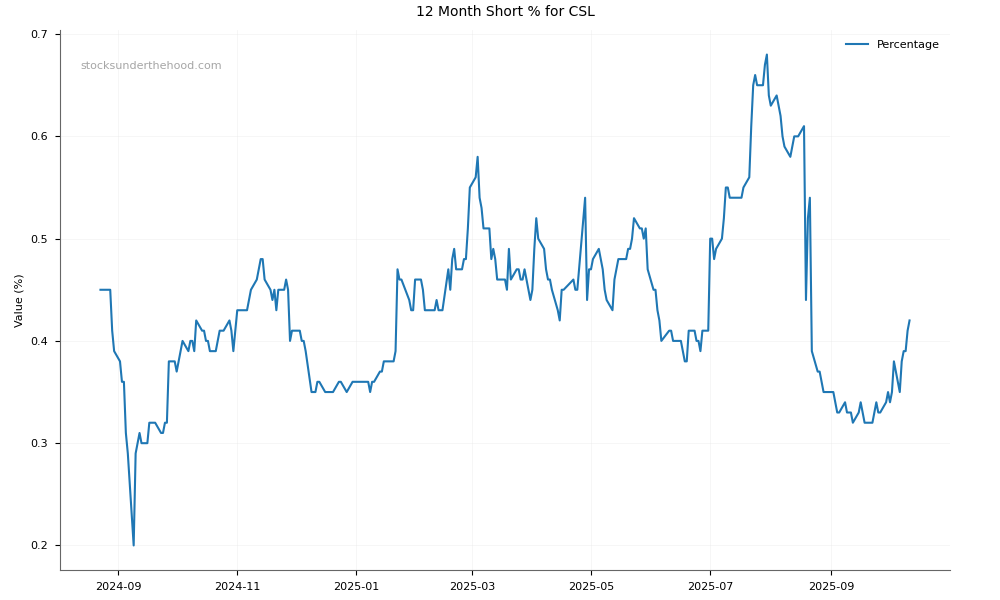
CSL Short Positions
Click HERE to understand why the above moving averages have been chosen.