Dexus is a leading Australian real estate group, managing a high-quality portfolio of office, industrial, and retail properties across key markets.
Ticker code: DXS
Sector: Real Estate | Industry: REIT – Office | Website: https://www.dexus.com
Market Information
| Market Capitalisation | Enterprise Value | Shares Outstanding | Free Float [%] | Free Float Value |
|---|---|---|---|---|
| $7,668,780,327 | $12,348,280,551 | 1075565246 | 94.67 | $7,260,207,685 |
Balance Sheet & Quality
| Equity | Cash | Debt | Return On Equity (ROE) | EBITDA 25 Margin [%] | Net Debt / Equity [%] | Rule of 40 |
|---|---|---|---|---|---|---|
| $9,926,391,449 | $167,400,000 | $4,846,900,224 | 0.0 | None | 47.1 | None |
Technicals & Short Data
| 3EMA Status | Volatility [%] | Value Traded Today | Average Daily Liquidity | Short [%] | Days To Cover |
|---|---|---|---|---|---|
| Negative | 2.6 | $20,653,400 | $22,897,432 | 2.0 | 6.7 |
Dividends
| Previous Dividend | Last Dividend | Franking [%] | Ex-Div Date | Gross Yield [%] |
|---|---|---|---|---|
| $0.190 | $0.180 | 100.0 | 2025-06-27 | 3.6 |
Price Performance Snapshot
| Last Traded Price | Change [%] | 1 Week [%] | 1 Month [%] | 3 Months [%] | 6 Months [%] | 12 Months [%] |
|---|---|---|---|---|---|---|
| $7.130 | 0.4 | -3.3 | -1.7 | -3.0 | 5.4 | 9.7 |
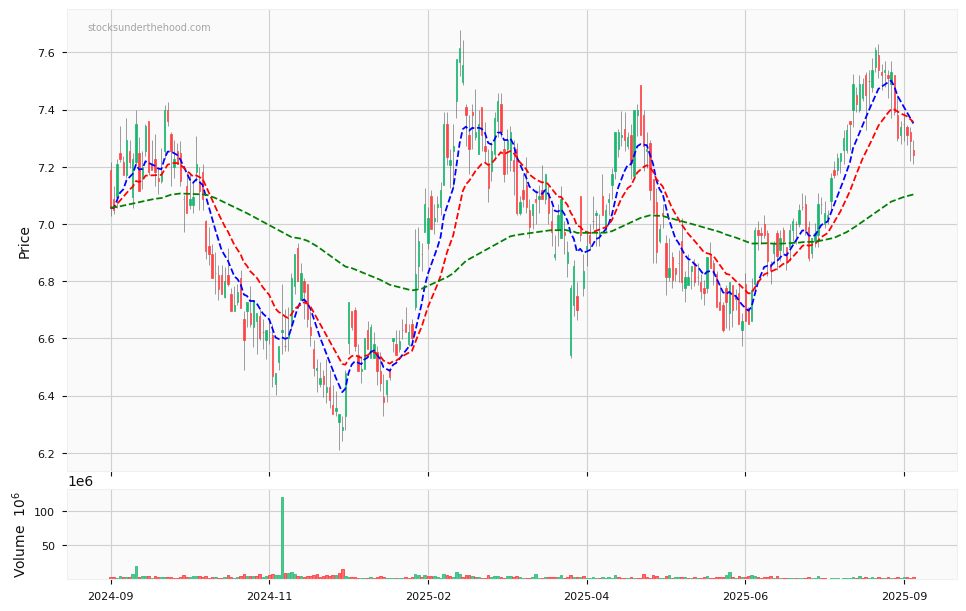
DXS Price Chart with Volume and 3EMA
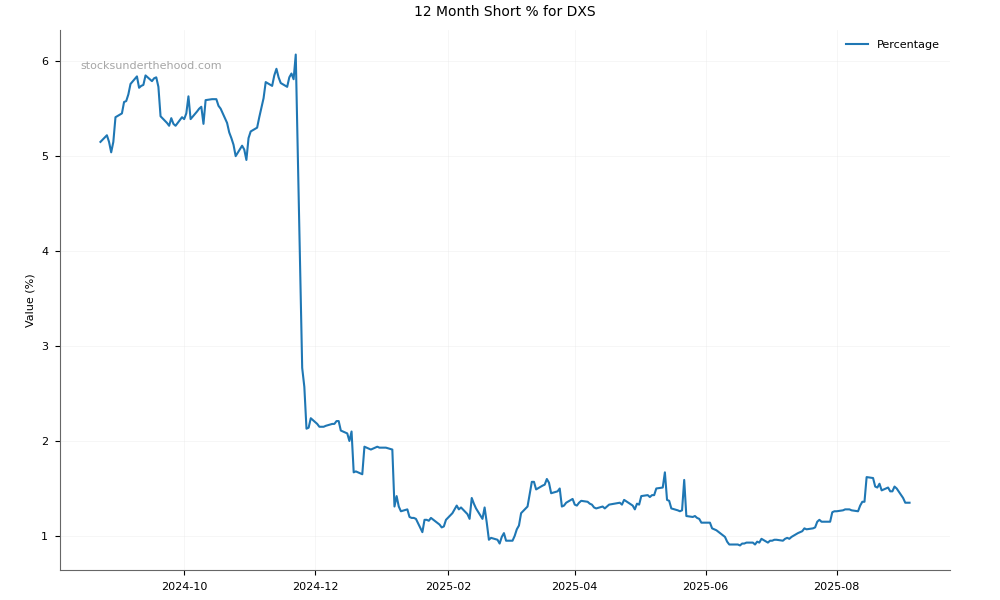
DXS Short Positions
Click HERE to understand why the above moving averages have been chosen.