DGL Group Limited operates in the chemical manufacturing and distribution industry, providing a range of chemical products and services across Australia and New Zealand.
Ticker code: DGL
Sector: Basic Materials | Industry: Specialty Chemicals | Website: https://www.dglgroup.com
Market Information
| Market Capitalisation | Enterprise Value | Shares Outstanding | Free Float [%] | Free Float Value |
|---|---|---|---|---|
| $152,595,522 | $312,662,514 | 285225261 | 35.88 | $54,748,221 |
Balance Sheet & Quality
| Equity | Cash | Debt | Return On Equity (ROE) | EBITDA 25 Margin [%] | Net Debt / Equity [%] | Rule of 40 |
|---|---|---|---|---|---|---|
| $338,277,155 | $17,122,000 | $177,188,992 | 5.0 | 12.6 | 47.3 | 28.5 |
Technicals & Short Data
| 3EMA Status | Volatility [%] | Value Traded Today | Average Daily Liquidity | Short [%] | Days To Cover |
|---|---|---|---|---|---|
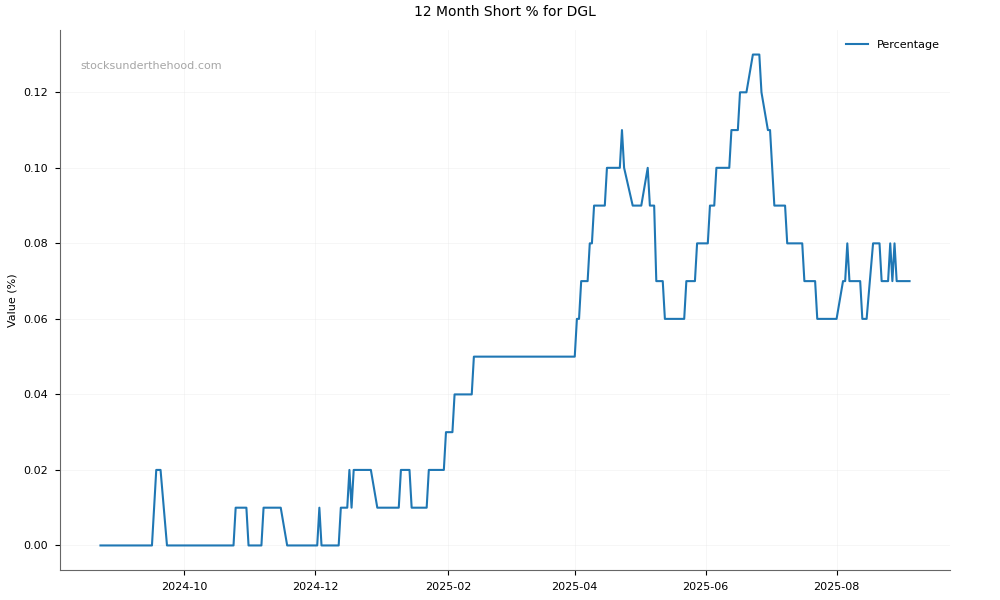
| Positive | 5.5 | $66,819 | $72,894 | 0.08 | 1.7 |
Dividends
| Previous Dividend | Last Dividend | Franking [%] | Ex-Div Date | Gross Yield [%] |
|---|---|---|---|---|
| None | None | None | None | 0.0 |
Price Performance Snapshot
| Last Traded Price | Change [%] | 1 Week [%] | 1 Month [%] | 3 Months [%] | 6 Months [%] | 12 Months [%] |
|---|---|---|---|---|---|---|
| $0.535 | None | None | 0.9 | 35.4 | 21.6 | -7.8 |
DGL Price Chart with Volume and 3EMA

DGL Short Positions
Click HERE to understand why the above moving averages have been chosen.