Ticker code: ASX:DGT
ASX:DGT Red Flags & Risk Indicators
❌
❌
⚠️ RED FLAGS: 5 identified
- Low Operating Margin
- Highly Shorted
- Falling Earnings
- Market Cap < Liabilities
- Falling EBITDA Margins
Income Statement
| Revenue 2024 Per Share | Revenue 2025e Per Share | Revenue 2026e Per Share | Revenue 24 to 25e [%] | Revenue 25e to 26e [%] | EBITDA 2024 Per Share | EBITDA 2025e Per Share | EBITDA 2026e Per Share | EBITDA 24 to 25e [%] | EBITDA 25e to 26e [%] |
|---|---|---|---|---|---|---|---|---|---|
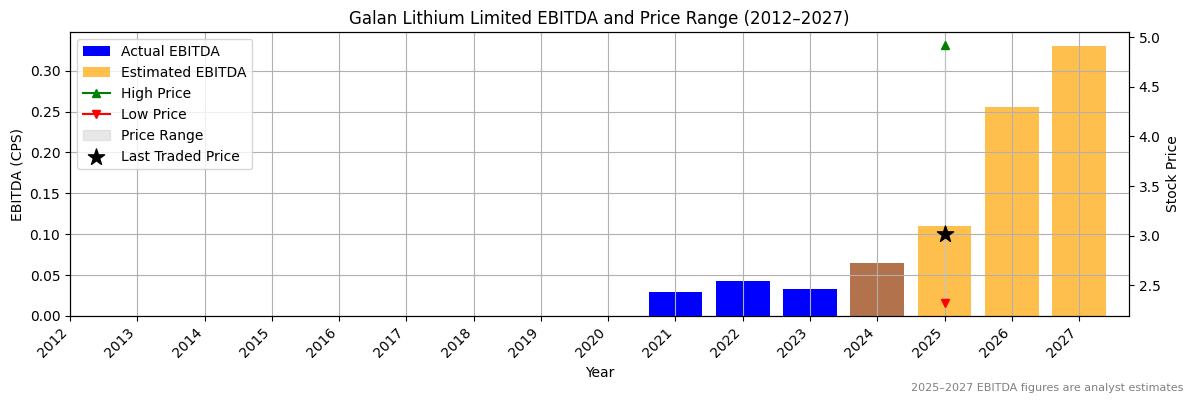
| 0.09864 | 0.18663 | 0.44508 | 89.2 | 138.5 | 0.06453 | 0.11055 | 0.25513 | 71.3 | 130.8 |
ASX:DGT Revenue Per Share (2012–2027)
✅✅
✅✅

ASX:DGT Earnings before Interest, Tax, Depreciation and Amortisation (EBITDA) Per Share (2012–2027)
✅✅
✅✅
ASX:DGT Normalised Earnings Per Share (EPS) (2012–2027)
✅✅
✅✅

Valuation
| Price To Sales | Price To Book | PER 2023 | PER 2024 | 13Y Median PER Low | PER 2025e | 13Y Median PER High | PER 2026e | Last Updated |
|---|---|---|---|---|---|---|---|---|
| None | 0.7 | None | None | 232.0 | 309.0 | 492.0 | 154.5 | 22/8/25 |
ASX:DGT Yearly Price Earnings Ratio (PER) Highs and Lows
✅
✅

ASX:DGT Weekly Price Chart with Average True Range (ATR) Trailing Stop (10-Year View)
