Dyno Nobel Limited is a global industrial chemicals company manufacturing and distributing fertilizers, explosives, and industrial chemicals for the agriculture and mining industries.
Ticker code: DNL
Sector: Basic Materials | Industry: Specialty Chemicals | Website: https://www.dynonobel.com.au
Market Information
| Market Capitalisation | Enterprise Value | Shares Outstanding | Free Float [%] | Free Float Value |
|---|---|---|---|---|
| $5,820,954,919 | $7,182,354,855 | 1791063052 | 93.42 | $5,437,768,586 |
Balance Sheet & Quality
| Equity | Cash | Debt | Return On Equity (ROE) | EBITDA 25 Margin [%] | Net Debt / Equity [%] | Rule of 40 |
|---|---|---|---|---|---|---|
| $4,320,044,143 | $655,600,000 | $2,016,999,936 | 8.0 | None | 31.5 | None |
Technicals & Short Data
| 3EMA Status | Volatility [%] | Value Traded Today | Average Daily Liquidity | Short [%] | Days To Cover |
|---|---|---|---|---|---|
| Partial | 5.2 | $19,855,212 | $16,222,382 | 0.53 | 1.9 |
Dividends
| Previous Dividend | Last Dividend | Franking [%] | Ex-Div Date | Gross Yield [%] |
|---|---|---|---|---|
| $0.024 | $0.095 | 55.0 | 2025-12-01 | 4.4 |
Price Performance Snapshot
| Last Traded Price | Change [%] | 1 Week [%] | 1 Month [%] | 3 Months [%] | 6 Months [%] | 12 Months [%] |
|---|---|---|---|---|---|---|
| $3.250 | -0.3 | -2.1 | -3.4 | 12.6 | 28.3 | 9.4 |
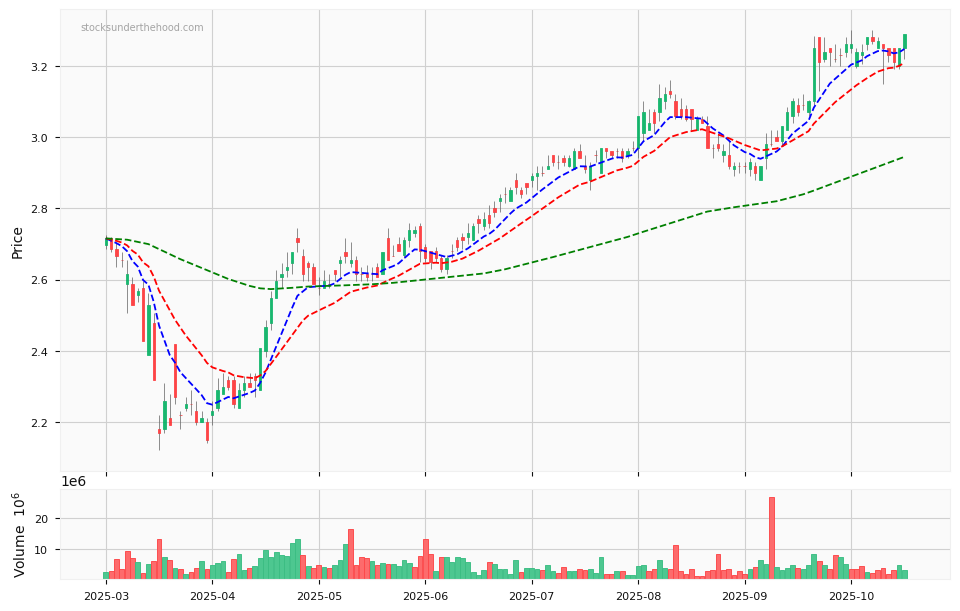
DNL Price Chart with Volume and 3EMA
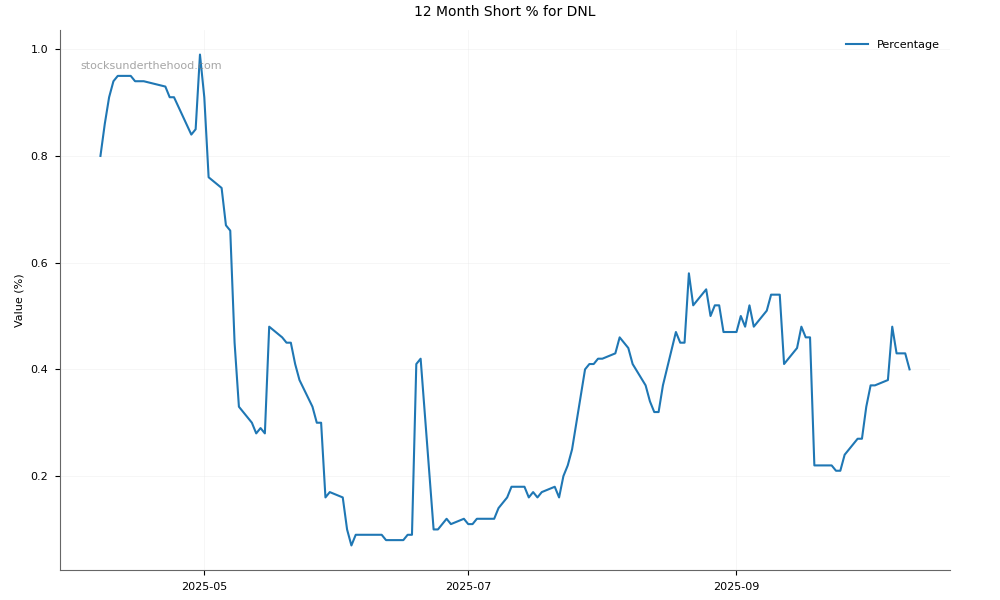
DNL Short Positions
Click HERE to understand why the above moving averages have been chosen.