Ebos Group Limited is a diversified healthcare and animal care company, distributing medical supplies, pharmaceuticals, and pet care products across Australasia.
Ticker code: EBO
Sector: Healthcare | Industry: Medical Distribution | Website: https://www.ebosgroup.com
Market Information
| Market Capitalisation | Enterprise Value | Shares Outstanding | Free Float [%] | Free Float Value |
|---|---|---|---|---|
| $4,847,850,508 | $6,287,254,540 | 203264169 | 94.09 | $4,561,161,555 |
Balance Sheet & Quality
| Equity | Cash | Debt | Return On Equity (ROE) | EBITDA 25 Margin [%] | Net Debt / Equity [%] | Rule of 40 |
|---|---|---|---|---|---|---|
| $2,740,000,785 | $184,251,008 | $1,623,655,040 | 10.0 | None | 52.5 | None |
Technicals & Short Data
| 3EMA Status | Volatility [%] | Value Traded Today | Average Daily Liquidity | Short [%] | Days To Cover |
|---|---|---|---|---|---|
| Negative | 3.4 | $2,866,532 | $3,076,268 | 0.48 | 7.6 |
Dividends
| Previous Dividend | Last Dividend | Franking [%] | Ex-Div Date | Gross Yield [%] |
|---|---|---|---|---|
| $0.459 | $0.492 | 95.0 | 2025-09-04 | 2.9 |
Price Performance Snapshot
| Last Traded Price | Change [%] | 1 Week [%] | 1 Month [%] | 3 Months [%] | 6 Months [%] | 12 Months [%] |
|---|---|---|---|---|---|---|
| $23.850 | -0.6 | -3.9 | -2.9 | -13.7 | -30.1 | -26.1 |
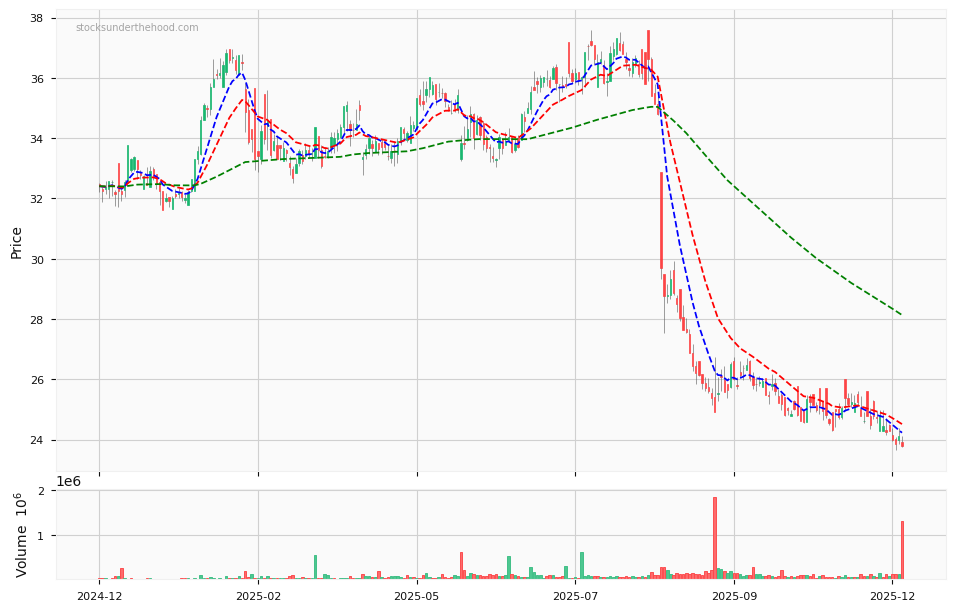
EBO Price Chart with Volume and 3EMA
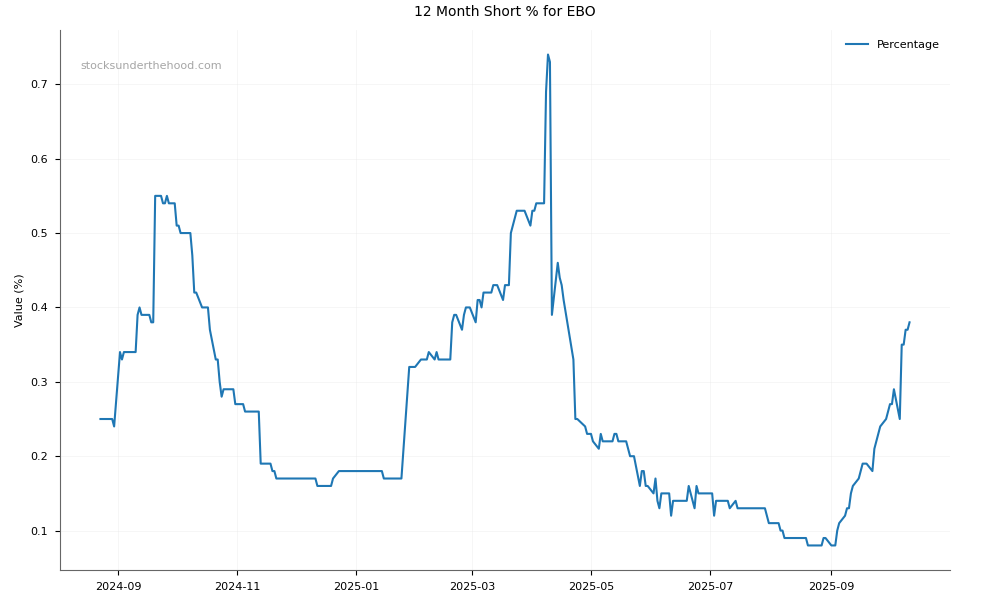
EBO Short Positions
Click HERE to understand why the above moving averages have been chosen.