Ticker code: EOS
EOS Red Flags & Risk Indicators
❌
❌
⚠️ RED FLAGS: 6 identified
- Negative Operating Cash Flow
- Increasing Shorts
- Falling Earnings
- Falling Revenues
- High Price to Book vs ROE
- Falling EBITDA Margins
Income Statement
| Revenue 2024 Per Share | Revenue 2025e Per Share | Revenue 2026e Per Share | Revenue 24 to 25e [%] | Revenue 25e to 26e [%] | EBITDA 2024 Per Share | EBITDA 2025e Per Share | EBITDA 2026e Per Share | EBITDA 24 to 25e [%] | EBITDA 25e to 26e [%] |
|---|---|---|---|---|---|---|---|---|---|
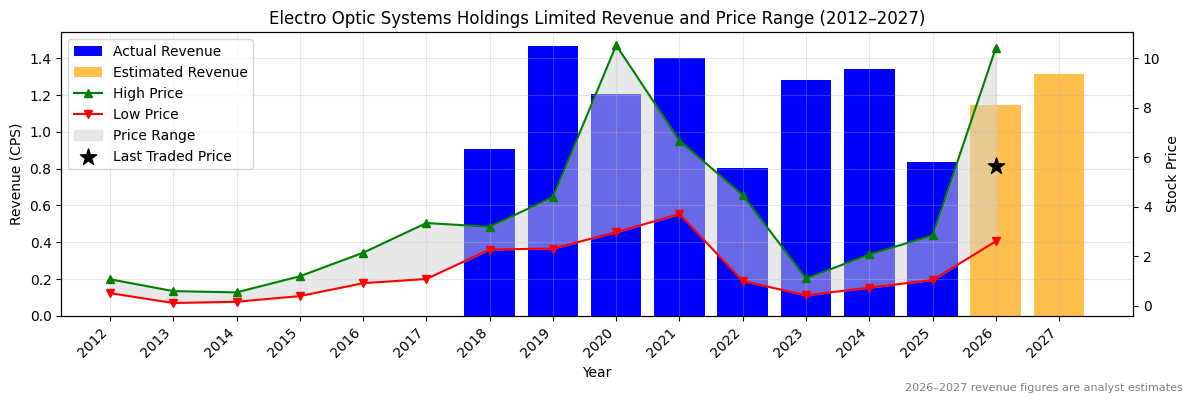
| 1.34075 | 0.83518 | 1.14744 | -37.7 | 37.4 | 0.06737 | -0.04115 | 0.04457 | -161.1 | 208.3 |
EOS Revenue Per Share (2012–2027)
❌
❌
EOS Earnings before Interest, Tax, Depreciation and Amortisation (EBITDA) Per Share (2012–2027)
❌
❌

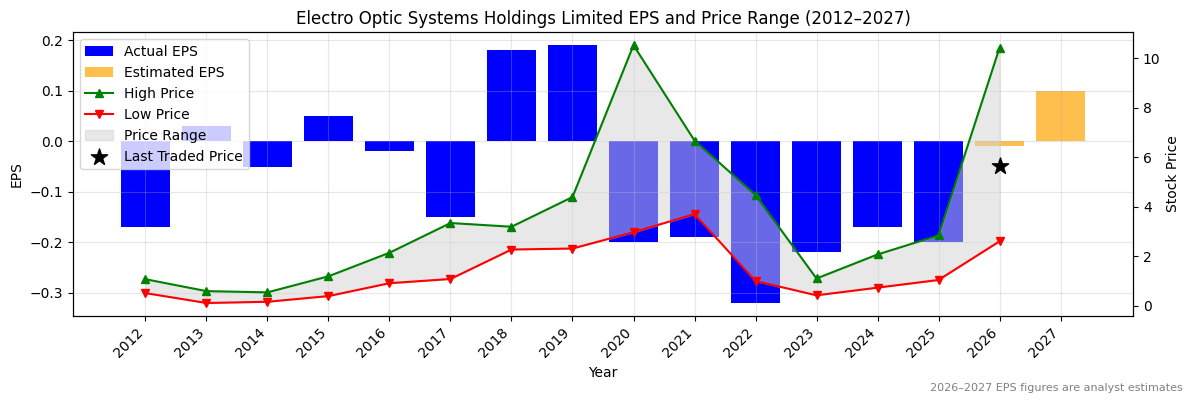
EOS Normalised Earnings Per Share (EPS) (2012–2027)
❌
❌
Valuation
| Price To Sales | Price To Book | PER 2023 | PER 2024 | 13Y Median PER Low | PER 2025e | 13Y Median PER High | PER 2026e | Last Updated |
|---|---|---|---|---|---|---|---|---|
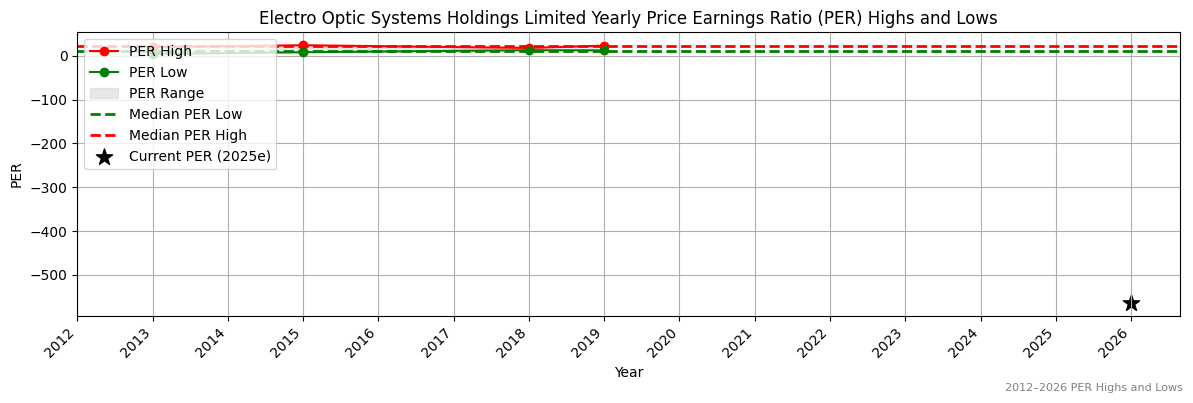
| 10.4 | 4.4 | -28.2 | -36.5 | 10.1 | -31.1 | 21.6 | -621.0 | 27/9/25 |
EOS Yearly Price Earnings Ratio (PER) Highs and Lows
✅✅
✅✅
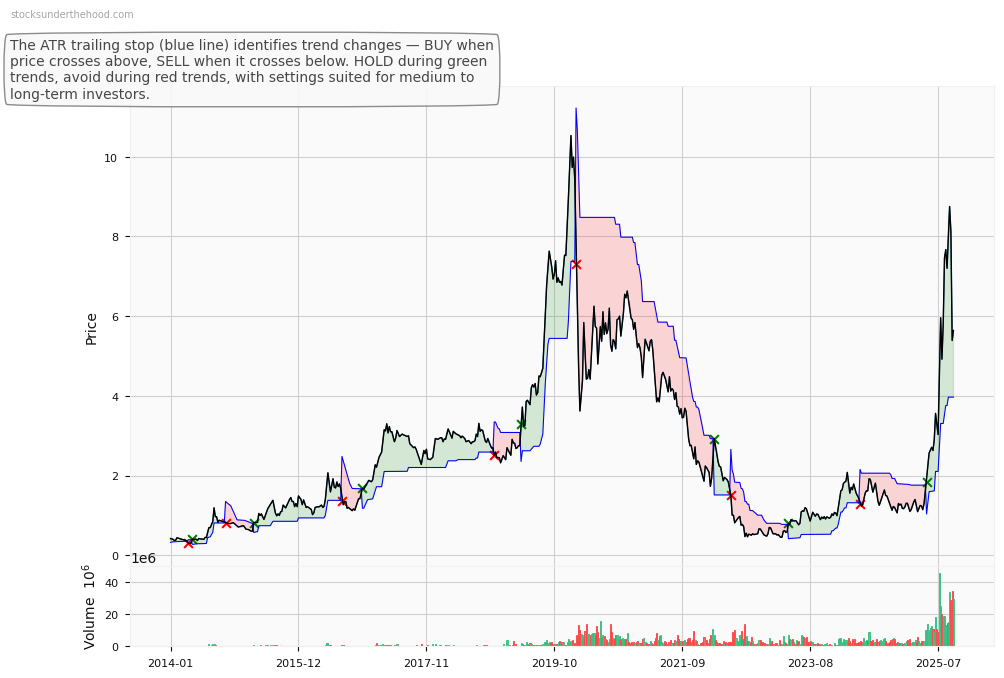
EOS Weekly Price Chart with Average True Range (ATR) Trailing Stop (10-Year View)