Elixir Energy Limited is an oil and gas exploration company focused on developing natural gas resources, particularly coal seam gas projects in Mongolia.
Ticker code: EXR
Sector: Energy | Industry: Oil & Gas E&P | Website: https://elixirenergy.com.au
Market Information
| Market Capitalisation | Enterprise Value | Shares Outstanding | Free Float [%] | Free Float Value |
|---|---|---|---|---|
| $103,222,133 | $96,646,112 | 1749527670 | 50.35 | $51,968,628 |
Balance Sheet & Quality
| Equity | Cash | Debt | Return On Equity (ROE) | EBITDA 25 Margin [%] | Net Debt / Equity [%] | Rule of 40 |
|---|---|---|---|---|---|---|
| $34,990,554 | $6,576,021 | $0 | 0.0 | None | -18.8 | None |
Technicals & Short Data
| 3EMA Status | Volatility [%] | Value Traded Today | Average Daily Liquidity | Short [%] | Days To Cover |
|---|---|---|---|---|---|
| Positive | 31.0 | $300,810 | $200,867 | 0.0 | 0.0 |
Dividends
| Previous Dividend | Last Dividend | Franking [%] | Ex-Div Date | Gross Yield [%] |
|---|---|---|---|---|
| None | None | None | None | 0.0 |
Price Performance Snapshot
| Last Traded Price | Change [%] | 1 Week [%] | 1 Month [%] | 3 Months [%] | 6 Months [%] | 12 Months [%] |
|---|---|---|---|---|---|---|
| $0.059 | -9.2 | -13.2 | 43.9 | 47.5 | 103.4 | 40.5 |
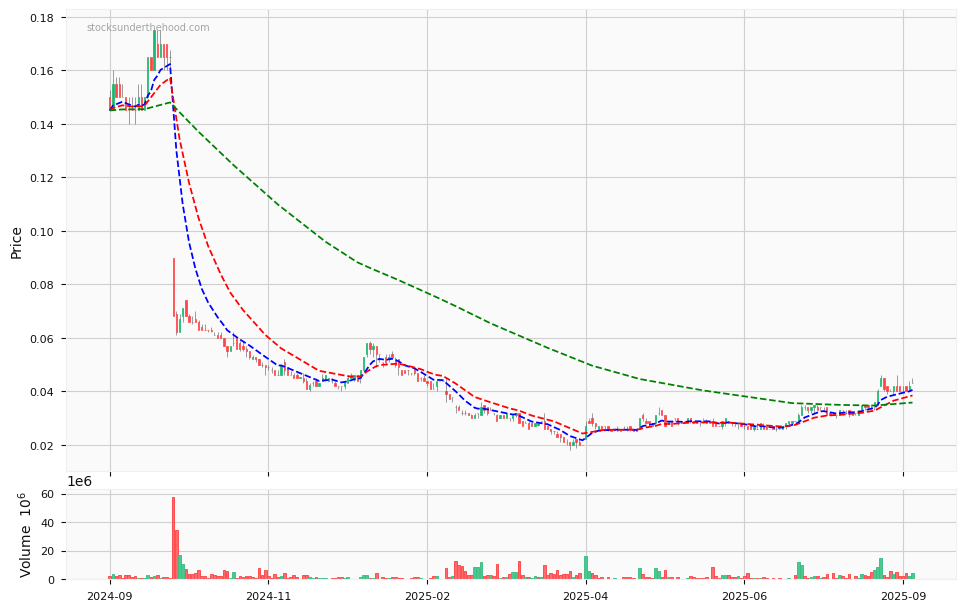
EXR Price Chart with Volume and 3EMA
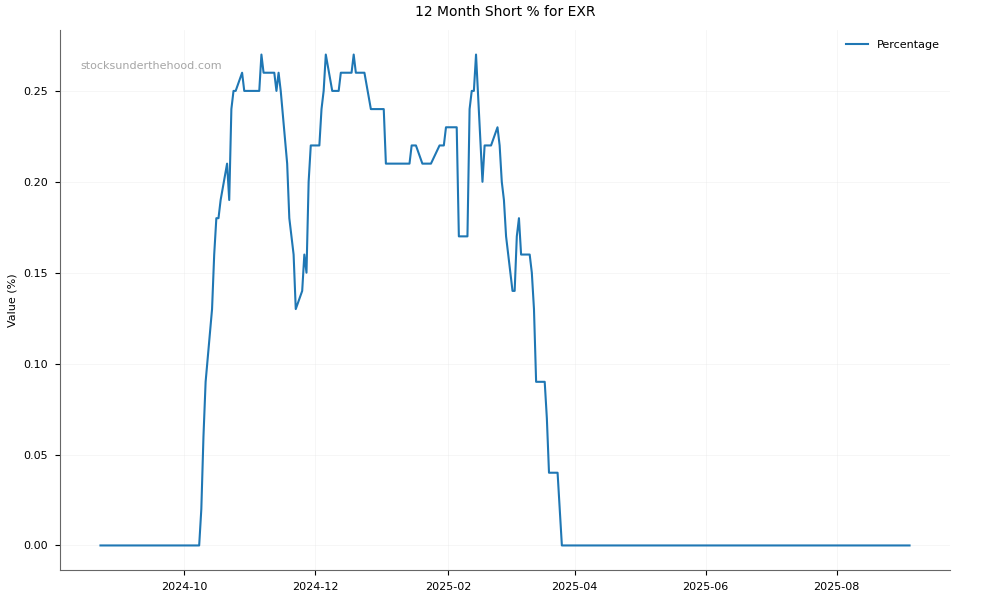
EXR Short Positions
Click HERE to understand why the above moving averages have been chosen.