EML Payments Limited offers payment solutions, including prepaid cards and payment processing services, to businesses and consumers globally.
Ticker code: EML
Sector: Technology | Industry: Software – Infrastructure | Website: https://emlpayments.com
Market Information
| Market Capitalisation | Enterprise Value | Shares Outstanding | Free Float [%] | Free Float Value |
|---|---|---|---|---|
| $312,118,740 | $306,879,740 | 387725140 | 73.09 | $228,121,821 |
Balance Sheet & Quality
| Equity | Cash | Debt | Return On Equity (ROE) | EBITDA 25 Margin [%] | Net Debt / Equity [%] | Rule of 40 |
|---|---|---|---|---|---|---|
| $148,498,714 | $59,316,000 | $54,077,000 | 18.3 | None | -3.5 | None |
Technicals & Short Data
| 3EMA Status | Volatility [%] | Value Traded Today | Average Daily Liquidity | Short [%] | Days To Cover |
|---|---|---|---|---|---|
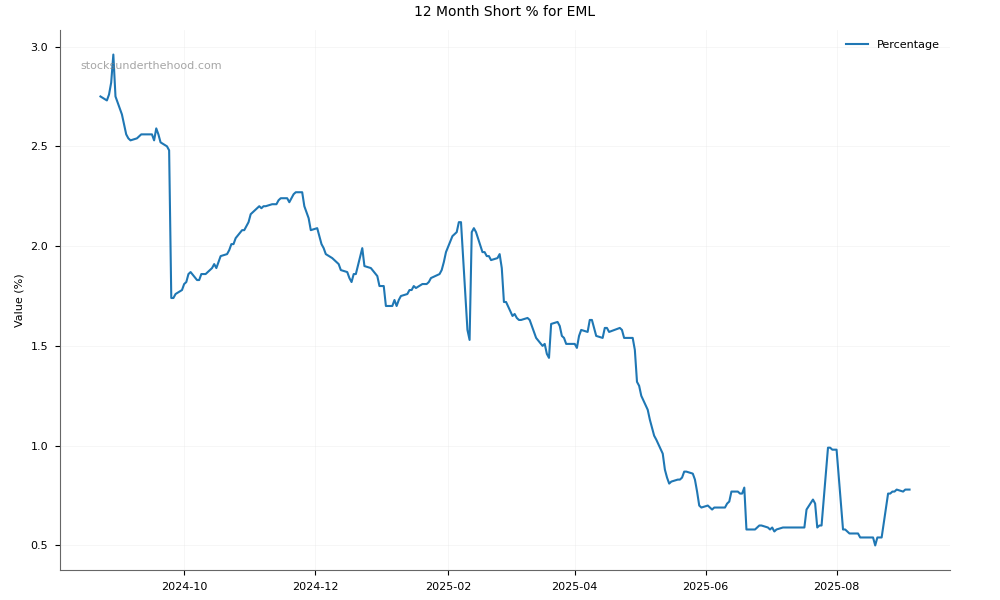
| Negative | 7.5 | $425,462 | $1,062,356 | 2.75 | 8.1 |
Dividends
| Previous Dividend | Last Dividend | Franking [%] | Ex-Div Date | Gross Yield [%] |
|---|---|---|---|---|
| None | None | None | None | 0.0 |
Price Performance Snapshot
| Last Traded Price | Change [%] | 1 Week [%] | 1 Month [%] | 3 Months [%] | 6 Months [%] | 12 Months [%] |
|---|---|---|---|---|---|---|
| $0.805 | 0.6 | -1.2 | -13.4 | -24.8 | -29.7 | -17.4 |
EML Price Chart with Volume and 3EMA

EML Short Positions
Click HERE to understand why the above moving averages have been chosen.