Evolution Mining Limited is a leading, growth-focused Australian gold miner, operating five wholly-owned mines across Australia and Canada.
Ticker code: EVN
Sector: Basic Materials | Industry: Gold | Website: https://evolutionmining.com.au
Market Information
| Market Capitalisation | Enterprise Value | Shares Outstanding | Free Float [%] | Free Float Value |
|---|---|---|---|---|
| $23,616,126,707 | $24,644,355,763 | 2030621365 | 97.63 | $23,055,484,374 |
Balance Sheet & Quality
| Equity | Cash | Debt | Return On Equity (ROE) | EBITDA 25 Margin [%] | Net Debt / Equity [%] | Rule of 40 |
|---|---|---|---|---|---|---|
| $5,027,818,639 | $759,633,984 | $1,787,863,040 | 16.3 | 51.0 | 20.5 | 80.5 |
Technicals & Short Data
| 3EMA Status | Volatility [%] | Value Traded Today | Average Daily Liquidity | Short [%] | Days To Cover |
|---|---|---|---|---|---|
| Positive | 7.9 | $54,643,602 | $95,542,219 | 1.7 | 4.2 |
Dividends
| Previous Dividend | Last Dividend | Franking [%] | Ex-Div Date | Gross Yield [%] |
|---|---|---|---|---|
| $0.070 | $0.130 | 100.0 | 2025-09-03 | 1.6 |
Price Performance Snapshot
| Last Traded Price | Change [%] | 1 Week [%] | 1 Month [%] | 3 Months [%] | 6 Months [%] | 12 Months [%] |
|---|---|---|---|---|---|---|
| $11.630 | -1.0 | -1.0 | 5.0 | 28.4 | 32.7 | 125.6 |
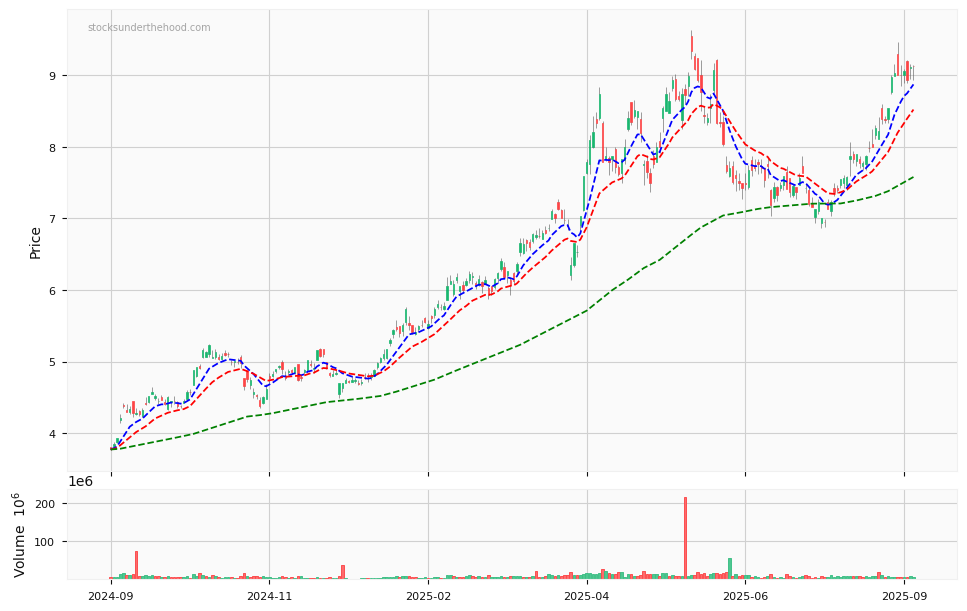
EVN Price Chart with Volume and 3EMA
EVN Short Positions

Click HERE to understand why the above moving averages have been chosen.