Fineos Corporation Holdings PLC provides software solutions for the life, accident, and health insurance industry, offering core systems for claims, billing, and policy administration.
Ticker code: FCL
Sector: Technology | Industry: Software – Infrastructure | Website: https://www.fineos.com
Market Information
| Market Capitalisation | Enterprise Value | Shares Outstanding | Free Float [%] | Free Float Value |
|---|---|---|---|---|
| $956,855,821 | $925,572,966 | 344192745 | 42.5 | $406,622,954 |
Balance Sheet & Quality
| Equity | Cash | Debt | Return On Equity (ROE) | EBITDA 25 Margin [%] | Net Debt / Equity [%] | Rule of 40 |
|---|---|---|---|---|---|---|
| $156,263,505 | $34,878,636 | $3,595,781 | 0.0 | 20.8 | -20.0 | 20.7 |
Technicals & Short Data
| 3EMA Status | Volatility [%] | Value Traded Today | Average Daily Liquidity | Short [%] | Days To Cover |
|---|---|---|---|---|---|
| Partial | 9.8 | $450,455 | $874,999 | 0.67 | 7.3 |
Dividends
| Previous Dividend | Last Dividend | Franking [%] | Ex-Div Date | Gross Yield [%] |
|---|---|---|---|---|
| None | None | None | None | 0.0 |
Price Performance Snapshot
| Last Traded Price | Change [%] | 1 Week [%] | 1 Month [%] | 3 Months [%] | 6 Months [%] | 12 Months [%] |
|---|---|---|---|---|---|---|
| $2.780 | -1.4 | -4.8 | -2.1 | -11.2 | 32.4 | 41.8 |
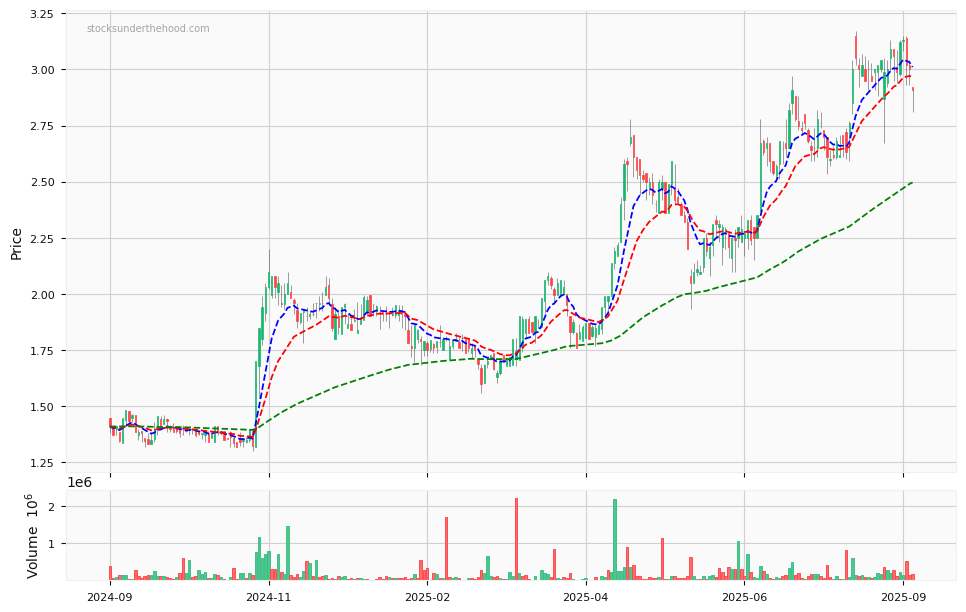
FCL Price Chart with Volume and 3EMA
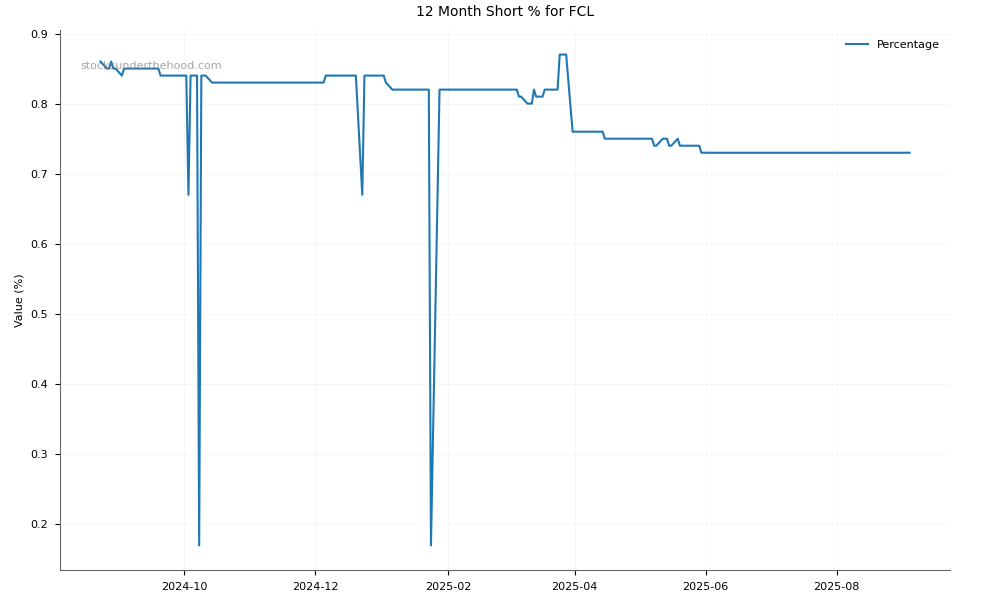
FCL Short Positions
Click HERE to understand why the above moving averages have been chosen.