FleetPartners Group Limited: Specializes in vehicle leasing and fleet management services across various sectors.
Ticker code: FPR
Sector: Industrials | Industry: Rental & Leasing Services | Website: https://www.fleetpartners.com.au
Market Information
| Market Capitalisation | Enterprise Value | Shares Outstanding | Free Float [%] | Free Float Value |
|---|---|---|---|---|
| $657,063,232 | $2,390,364,160 | 216139229 | 76.64 | $503,574,376 |
Balance Sheet & Quality
| Equity | Cash | Debt | Return On Equity (ROE) | EBITDA 25 Margin [%] | Net Debt / Equity [%] | Rule of 40 |
|---|---|---|---|---|---|---|
| $639,123,685 | $102,869,000 | $1,843,224,960 | None | None | 272.3 | None |
Technicals & Short Data
| 3EMA Status | Volatility [%] | Value Traded Today | Average Daily Liquidity | Short [%] | Days To Cover |
|---|---|---|---|---|---|
| Positive | 5.3 | $3,032,020 | $2,290,652 | None | 0.0 |
Dividends
| Previous Dividend | Last Dividend | Franking [%] | Ex-Div Date | Gross Yield [%] |
|---|---|---|---|---|
| None | None | None | 2018-12-13 | None |
Price Performance Snapshot
| Last Traded Price | Change [%] | 1 Week [%] | 1 Month [%] | 3 Months [%] | 6 Months [%] | 12 Months [%] |
|---|---|---|---|---|---|---|
| $3.040 | -3.2 | 0.7 | 6.7 | 9.4 | 1.7 | -1.9 |
FPR Price Chart with Volume and 3EMA

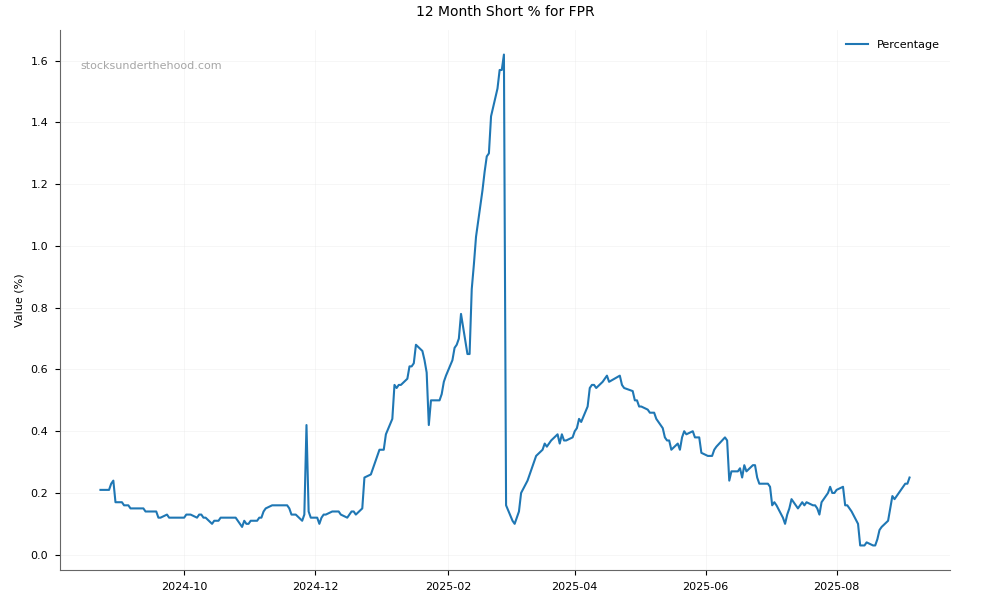
FPR Short Positions
Click HERE to understand why the above moving averages have been chosen.