Fluence Corporation Limited offers decentralized water and wastewater treatment solutions, providing sustainable and cost-effective technologies globally.
Ticker code: FLC
Sector: Industrials | Industry: Pollution & Treatment Controls | Website: https://www.fluencecorp.com
Market Information
| Market Capitalisation | Enterprise Value | Shares Outstanding | Free Float [%] | Free Float Value |
|---|---|---|---|---|
| $94,643,956 | $103,657,956 | 1087861591 | 38.48 | $36,419,919 |
Balance Sheet & Quality
| Equity | Cash | Debt | Return On Equity (ROE) | EBITDA 25 Margin [%] | Net Debt / Equity [%] | Rule of 40 |
|---|---|---|---|---|---|---|
| -$7,615,031 | $12,790,000 | $21,804,000 | 0.0 | None | -118.4 | None |
Technicals & Short Data
| 3EMA Status | Volatility [%] | Value Traded Today | Average Daily Liquidity | Short [%] | Days To Cover |
|---|---|---|---|---|---|
| Positive | 11.2 | $25,481 | $31,466 | 0.0 | 0.0 |
Dividends
| Previous Dividend | Last Dividend | Franking [%] | Ex-Div Date | Gross Yield [%] |
|---|---|---|---|---|
| None | None | None | 2008-09-25 | 0.0 |
Price Performance Snapshot
| Last Traded Price | Change [%] | 1 Week [%] | 1 Month [%] | 3 Months [%] | 6 Months [%] | 12 Months [%] |
|---|---|---|---|---|---|---|
| $0.087 | 8.7 | 7.4 | 50.0 | 52.6 | 89.1 | 8.7 |
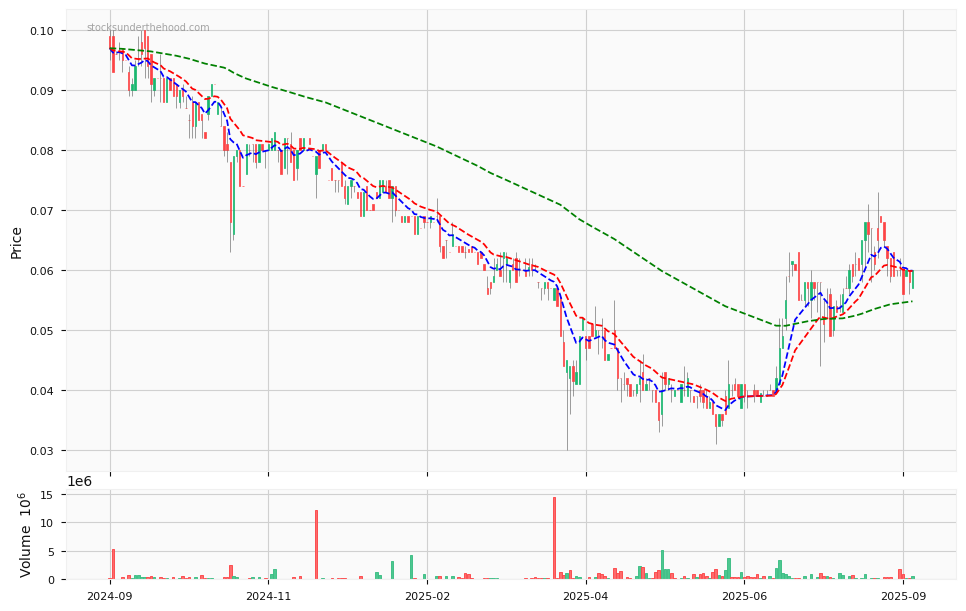
FLC Price Chart with Volume and 3EMA
FLC Short Positions
Click HERE to understand why the above moving averages have been chosen.