Frontier Digital Ventures Limited invests in online marketplace businesses in emerging markets, focusing on property and automotive classifieds platforms.
Ticker code: FDV
Sector: Communication Services | Industry: Internet Content & Information | Website: https://frontierdv.com
Market Information
| Market Capitalisation | Enterprise Value | Shares Outstanding | Free Float [%] | Free Float Value |
|---|---|---|---|---|
| $150,328,494 | $140,113,108 | 435734768 | 55.9 | $84,038,582 |
Balance Sheet & Quality
| Equity | Cash | Debt | Return On Equity (ROE) | EBITDA 25 Margin [%] | Net Debt / Equity [%] | Rule of 40 |
|---|---|---|---|---|---|---|
| $128,977,484 | $11,056,882 | $841,496 | 3.4 | 9.0 | -7.9 | 7.6 |
Technicals & Short Data
| 3EMA Status | Volatility [%] | Value Traded Today | Average Daily Liquidity | Short [%] | Days To Cover |
|---|---|---|---|---|---|
| Negative | 15.1 | $65,361 | $132,754 | 0.09 | 1.0 |
Dividends
| Previous Dividend | Last Dividend | Franking [%] | Ex-Div Date | Gross Yield [%] |
|---|---|---|---|---|
| None | None | None | None | 0.0 |
Price Performance Snapshot
| Last Traded Price | Change [%] | 1 Week [%] | 1 Month [%] | 3 Months [%] | 6 Months [%] | 12 Months [%] |
|---|---|---|---|---|---|---|
| $0.345 | 6.2 | 1.5 | -16.9 | -1.4 | 50.0 | -9.2 |
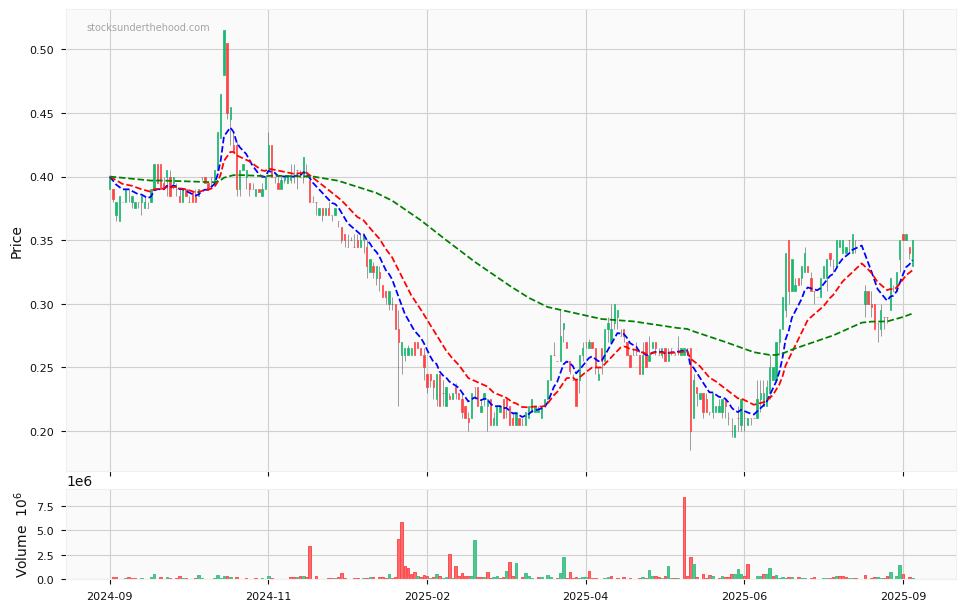
FDV Price Chart with Volume and 3EMA
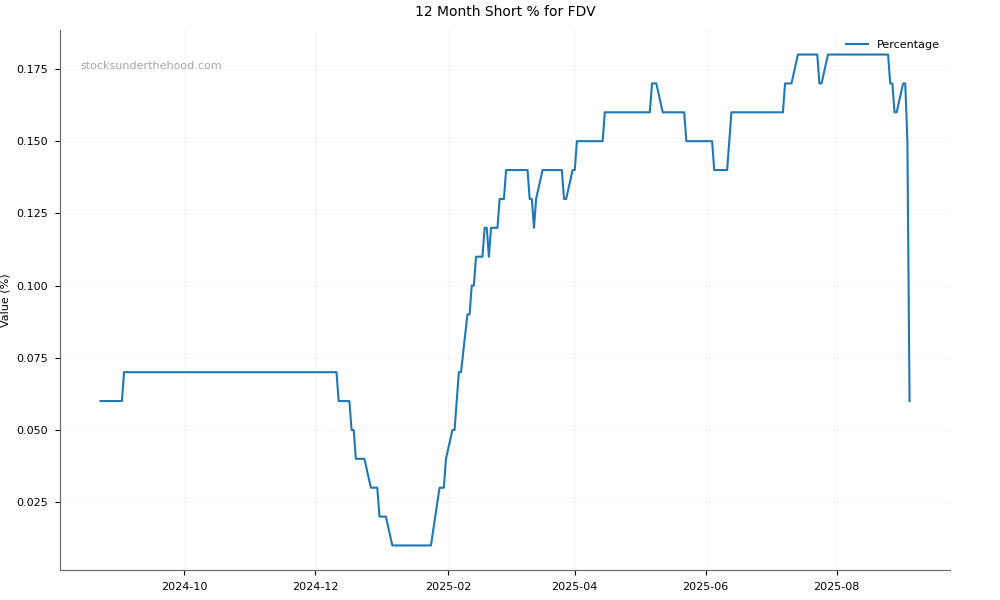
FDV Short Positions
Click HERE to understand why the above moving averages have been chosen.