Genesis Minerals Limited is a gold exploration and development company focused on projects in Western Australia, aiming to become a leading Australian gold producer.
Ticker code: GMD
Sector: Basic Materials | Industry: Gold | Website: https://www.genesisminerals.com.au
Market Information
| Market Capitalisation | Enterprise Value | Shares Outstanding | Free Float [%] | Free Float Value |
|---|---|---|---|---|
| $6,945,355,326 | $6,906,710,334 | 1142328193 | 92.11 | $6,397,588,677 |
Balance Sheet & Quality
| Equity | Cash | Debt | Return On Equity (ROE) | EBITDA 25 Margin [%] | Net Debt / Equity [%] | Rule of 40 |
|---|---|---|---|---|---|---|
| $1,266,841,948 | $239,532,000 | $200,887,008 | 17.8 | 49.2 | -3.1 | 135.1 |
Technicals & Short Data
| 3EMA Status | Volatility [%] | Value Traded Today | Average Daily Liquidity | Short [%] | Days To Cover |
|---|---|---|---|---|---|
| Positive | 10.7 | $19,013,364 | $38,755,956 | 5.37 | 9.6 |
Dividends
| Previous Dividend | Last Dividend | Franking [%] | Ex-Div Date | Gross Yield [%] |
|---|---|---|---|---|
| None | None | None | None | 0.0 |
Price Performance Snapshot
| Last Traded Price | Change [%] | 1 Week [%] | 1 Month [%] | 3 Months [%] | 6 Months [%] | 12 Months [%] |
|---|---|---|---|---|---|---|
| $6.080 | -1.5 | -7.2 | 0.8 | 13.4 | 33.3 | 121.9 |
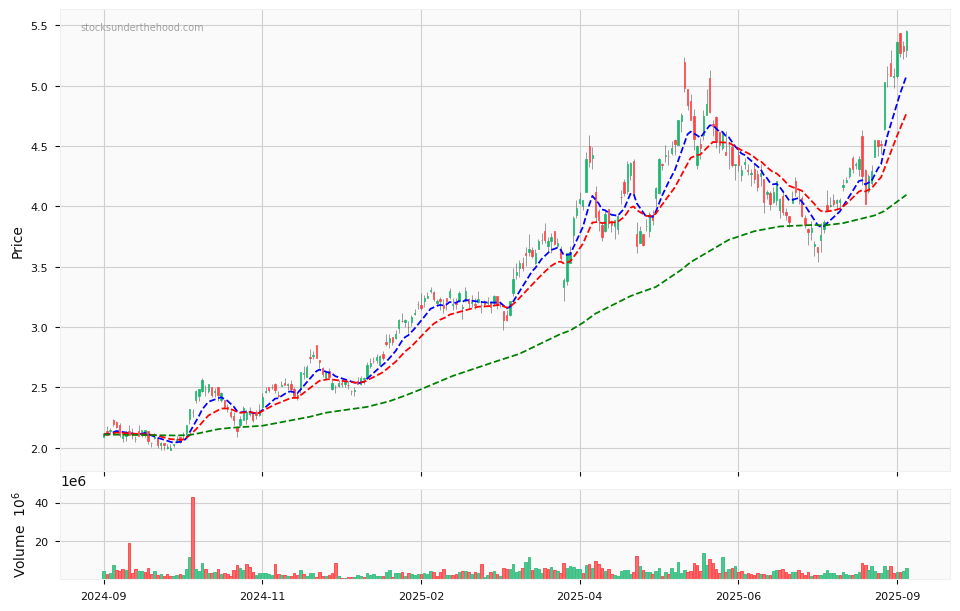
GMD Price Chart with Volume and 3EMA
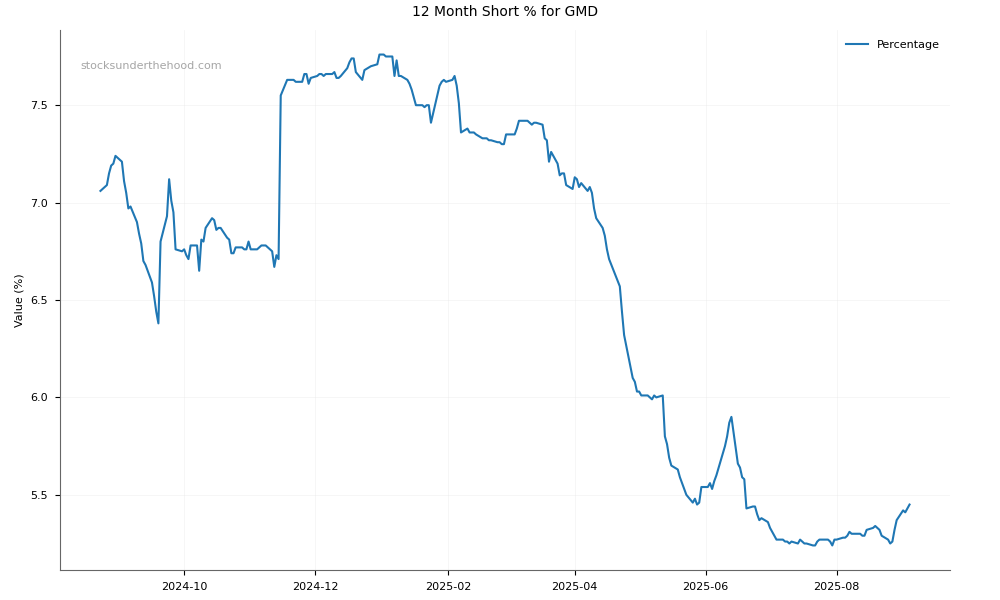
GMD Short Positions
Click HERE to understand why the above moving averages have been chosen.