The iShares MSCI Global Semiconductors ETF provides exposure to global semiconductor and semiconductor equipment companies. It tracks an index of semiconductor firms, focusing on industry leaders with strong ESG screening criteria.
Ticker code: SEMI
Sector: International | Industry: ETF | Website: https://www.globalxetfs.com.au/funds/semi/
Market Information
| Market Capitalisation | Enterprise Value | Shares Outstanding | Free Float [%] | Free Float Value |
|---|---|---|---|---|
| None | None | None | 0.0 | None |
Balance Sheet & Quality
| Equity | Cash | Debt | Return On Equity (ROE) | EBITDA 25 Margin [%] | Net Debt / Equity [%] | Rule of 40 |
|---|---|---|---|---|---|---|
| None | None | None | None | None | 0.0 | None |
Technicals & Short Data
| 3EMA Status | Volatility [%] | Value Traded Today | Average Daily Liquidity | Short [%] | Days To Cover |
|---|---|---|---|---|---|
| None | 2.1 | $1,155,329 | $2,274,083 | None | 0.0 |
Dividends
| Previous Dividend | Last Dividend | Franking [%] | Ex-Div Date | Gross Yield [%] |
|---|---|---|---|---|
| $0.026 | $1.269 | None | 2025-06-30 | None |
Price Performance Snapshot
| Last Traded Price | Change [%] | 1 Week [%] | 1 Month [%] | 3 Months [%] | 6 Months [%] | 12 Months [%] |
|---|---|---|---|---|---|---|
| $22.690 | 2.4 | 0.3 | 12.5 | 27.0 | 65.4 | 42.8 |
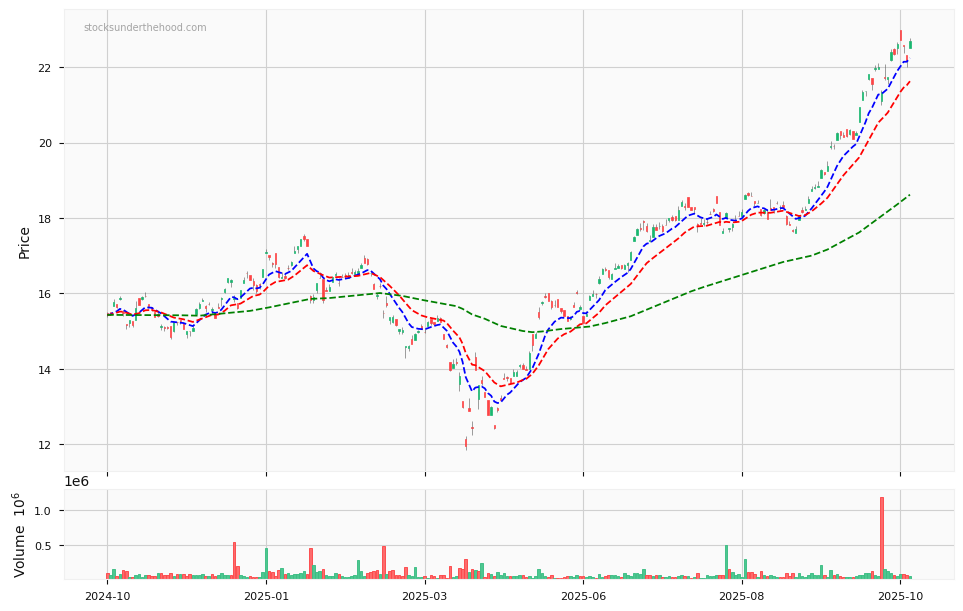
SEMI Price Chart with Volume and 3EMA
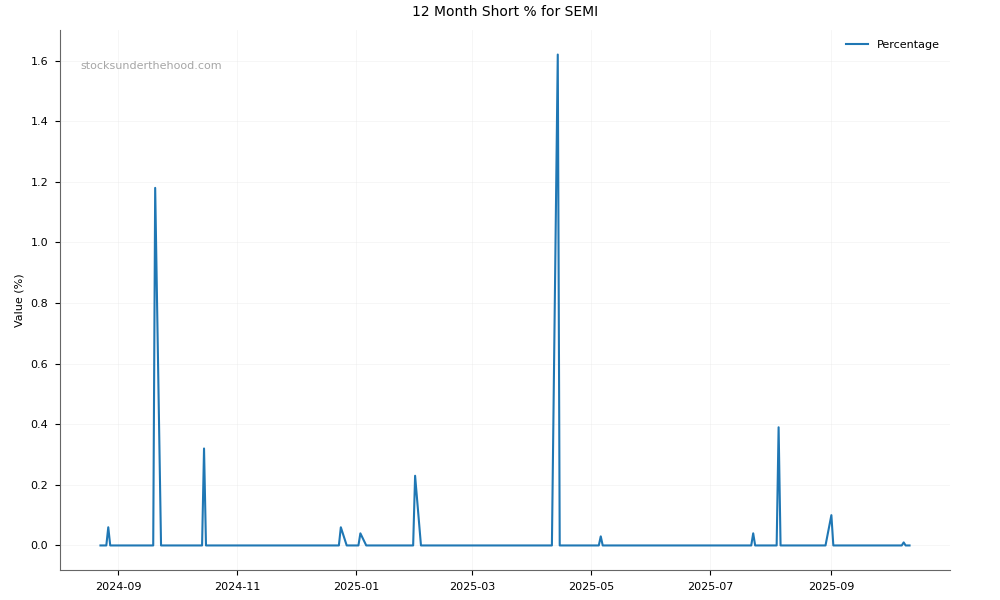
SEMI Short Positions
Click HERE to understand why the above moving averages have been chosen.