GQG Partners Inc. is a global boutique asset management firm specializing in active equity portfolios, serving institutional clients and offering investment strategies across various markets.
Ticker code: GQG
Sector: Financial Services | Industry: Asset Management | Website: https://gqg.com
Market Information
| Market Capitalisation | Enterprise Value | Shares Outstanding | Free Float [%] | Free Float Value |
|---|---|---|---|---|
| $5,262,453,523 | $5,188,278,523 | 2964762588 | 24.33 | $1,280,356,061 |
Balance Sheet & Quality
| Equity | Cash | Debt | Return On Equity (ROE) | EBITDA 25 Margin [%] | Net Debt / Equity [%] | Rule of 40 |
|---|---|---|---|---|---|---|
| $638,495,552 | $100,277,000 | $26,102,000 | 74.0 | 75.2 | -11.6 | 83.8 |
Technicals & Short Data
| 3EMA Status | Volatility [%] | Value Traded Today | Average Daily Liquidity | Short [%] | Days To Cover |
|---|---|---|---|---|---|
| Partial | 15.2 | $5,183,309 | $12,535,357 | 1.28 | 5.4 |
Dividends
| Previous Dividend | Last Dividend | Franking [%] | Ex-Div Date | Gross Yield [%] |
|---|---|---|---|---|
| $0.055 | $0.057 | None | 2025-10-21 | 6.3 |
Price Performance Snapshot
| Last Traded Price | Change [%] | 1 Week [%] | 1 Month [%] | 3 Months [%] | 6 Months [%] | 12 Months [%] |
|---|---|---|---|---|---|---|
| $1.775 | -0.6 | -0.8 | 20.7 | 5.8 | -10.0 | -13.0 |
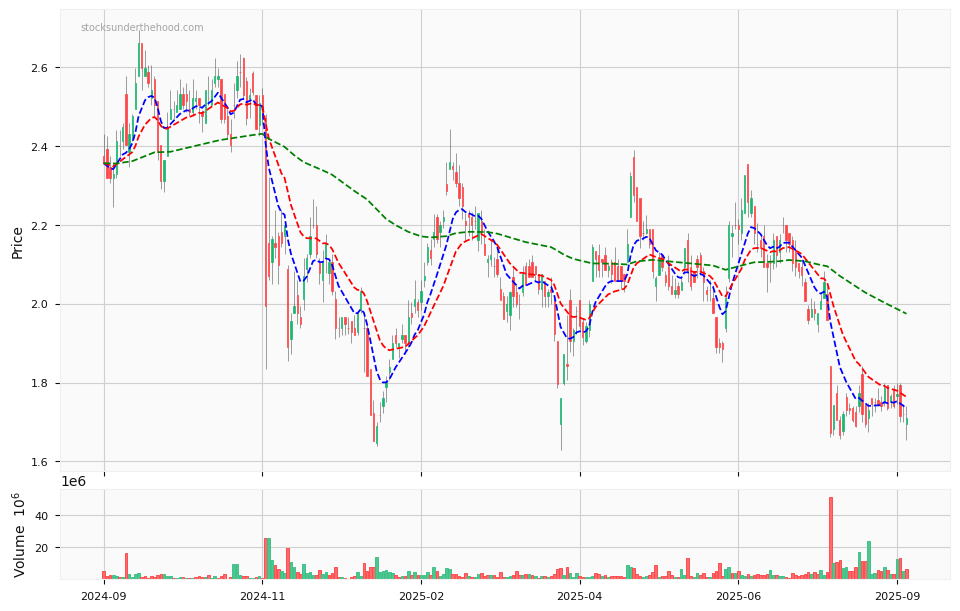
GQG Price Chart with Volume and 3EMA
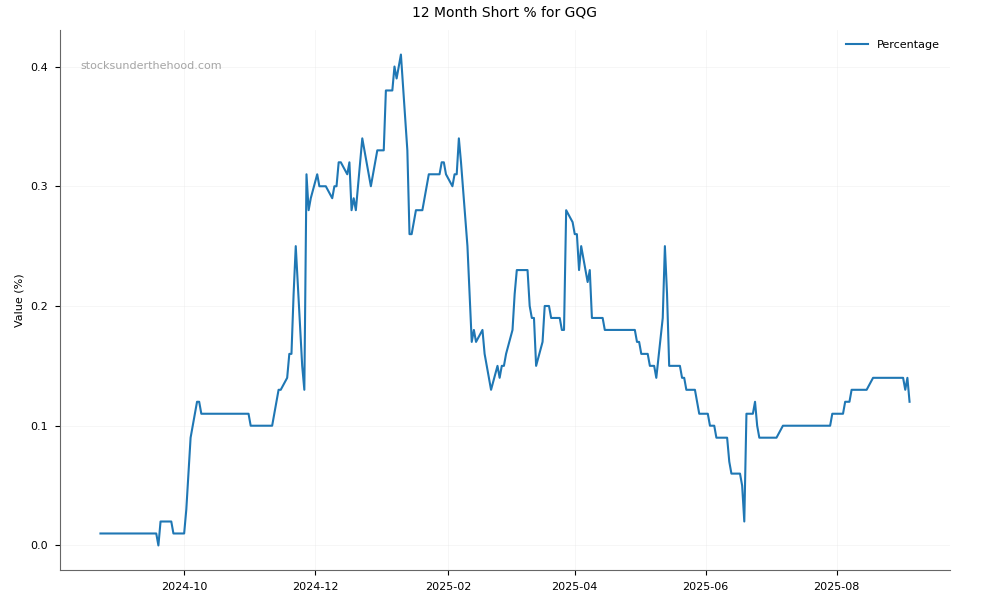
GQG Short Positions
Click HERE to understand why the above moving averages have been chosen.