Harvey Norman Holdings Limited is a multinational retailer selling furniture, bedding, computers, communications, and consumer electrical products through its franchised stores and company-operated outlets.
Ticker code: HVN
Sector: Consumer Cyclical | Industry: Specialty Retail | Website: https://www.harveynormanholdings.com.au
Market Information
| Market Capitalisation | Enterprise Value | Shares Outstanding | Free Float [%] | Free Float Value |
|---|---|---|---|---|
| $8,921,407,452 | $10,937,585,564 | 1246006654 | 41.91 | $3,738,872,652 |
Balance Sheet & Quality
| Equity | Cash | Debt | Return On Equity (ROE) | EBITDA 25 Margin [%] | Net Debt / Equity [%] | Rule of 40 |
|---|---|---|---|---|---|---|
| $4,803,355,924 | $279,688,000 | $2,295,866,112 | 8.6 | 22.5 | 42.0 | 26.5 |
Technicals & Short Data
| 3EMA Status | Volatility [%] | Value Traded Today | Average Daily Liquidity | Short [%] | Days To Cover |
|---|---|---|---|---|---|
| Partial | 3.9 | $10,495,930 | $15,466,165 | 1.77 | 10.2 |
Dividends
| Previous Dividend | Last Dividend | Franking [%] | Ex-Div Date | Gross Yield [%] |
|---|---|---|---|---|
| $0.120 | $0.145 | 100.0 | 2025-10-06 | 2.9 |
Price Performance Snapshot
| Last Traded Price | Change [%] | 1 Week [%] | 1 Month [%] | 3 Months [%] | 6 Months [%] | 12 Months [%] |
|---|---|---|---|---|---|---|
| $7.160 | -2.2 | 0.3 | -3.2 | -1.6 | 33.7 | 54.8 |
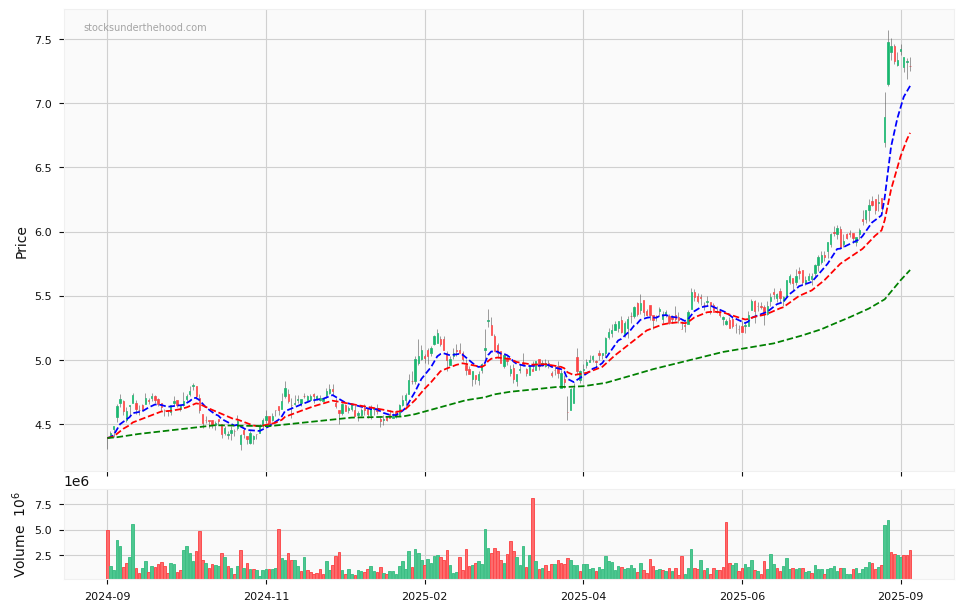
HVN Price Chart with Volume and 3EMA
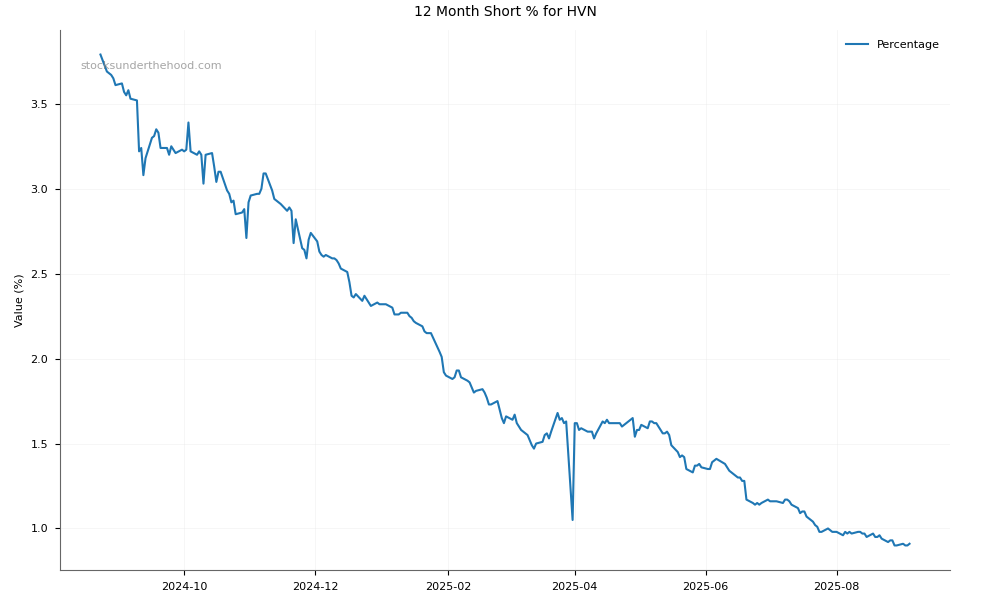
HVN Short Positions
Click HERE to understand why the above moving averages have been chosen.