Inoviq Limited develops and commercializes diagnostic and exosome-based products to improve the diagnosis and treatment of cancer and other diseases, aiming to enhance patient outcomes.
Ticker code: IIQ
Sector: Healthcare | Industry: Diagnostics & Research | Website: https://www.inoviq.com
Market Information
| Market Capitalisation | Enterprise Value | Shares Outstanding | Free Float [%] | Free Float Value |
|---|---|---|---|---|
| $49,271,409 | $43,126,675 | 140775458 | 63.21 | $31,144,268 |
Balance Sheet & Quality
| Equity | Cash | Debt | Return On Equity (ROE) | EBITDA 25 Margin [%] | Net Debt / Equity [%] | Rule of 40 |
|---|---|---|---|---|---|---|
| $21,116,319 | $6,520,923 | $376,189 | -39.6 | -480.3 | -29.1 | None |
Technicals & Short Data
| 3EMA Status | Volatility [%] | Value Traded Today | Average Daily Liquidity | Short [%] | Days To Cover |
|---|---|---|---|---|---|
| Negative | 4.8 | $5,952 | $64,705 | 0.0 | 0.0 |
Dividends
| Previous Dividend | Last Dividend | Franking [%] | Ex-Div Date | Gross Yield [%] |
|---|---|---|---|---|
| None | None | None | None | 0.0 |
Price Performance Snapshot
| Last Traded Price | Change [%] | 1 Week [%] | 1 Month [%] | 3 Months [%] | 6 Months [%] | 12 Months [%] |
|---|---|---|---|---|---|---|
| $0.350 | 1.4 | 1.4 | 2.9 | -12.5 | -22.2 | -34.6 |
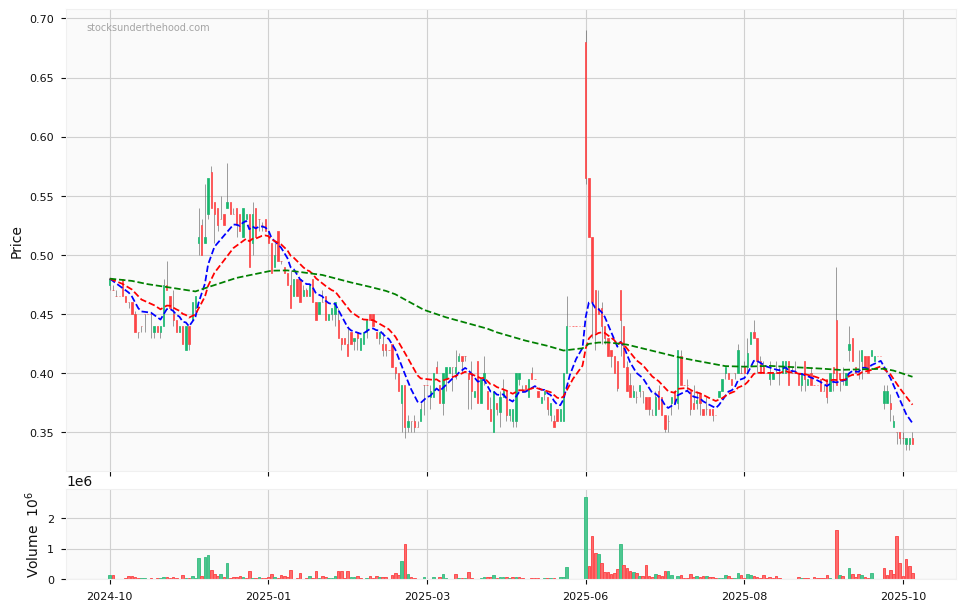
IIQ Price Chart with Volume and 3EMA
IIQ Short Positions

Click HERE to understand why the above moving averages have been chosen.