IPD Group Limited distributes electrical equipment and offers specialist services to the Australian electrical industry, providing products for power distribution, automation, and energy management.
Ticker code: IPG
Sector: Industrials | Industry: Specialty Industrial Machinery | Website: https://www.ipdgroup.com.au
Market Information
| Market Capitalisation | Enterprise Value | Shares Outstanding | Free Float [%] | Free Float Value |
|---|---|---|---|---|
| $379,055,036 | $389,746,036 | 103850692 | 73.93 | $280,254,260 |
Balance Sheet & Quality
| Equity | Cash | Debt | Return On Equity (ROE) | EBITDA 25 Margin [%] | Net Debt / Equity [%] | Rule of 40 |
|---|---|---|---|---|---|---|
| $164,187,941 | $20,855,000 | $31,546,000 | 15.8 | 13.1 | 6.5 | 35.8 |
Technicals & Short Data
| 3EMA Status | Volatility [%] | Value Traded Today | Average Daily Liquidity | Short [%] | Days To Cover |
|---|---|---|---|---|---|
| Negative | 3.9 | $207,123 | $487,472 | 0.2 | 1.6 |
Dividends
| Previous Dividend | Last Dividend | Franking [%] | Ex-Div Date | Gross Yield [%] |
|---|---|---|---|---|
| $0.064 | $0.062 | 100.0 | 2025-09-23 | 2.4 |
Price Performance Snapshot
| Last Traded Price | Change [%] | 1 Week [%] | 1 Month [%] | 3 Months [%] | 6 Months [%] | 12 Months [%] |
|---|---|---|---|---|---|---|
| $3.650 | -1.4 | -1.4 | -8.1 | 4.4 | -6.2 | -15.8 |
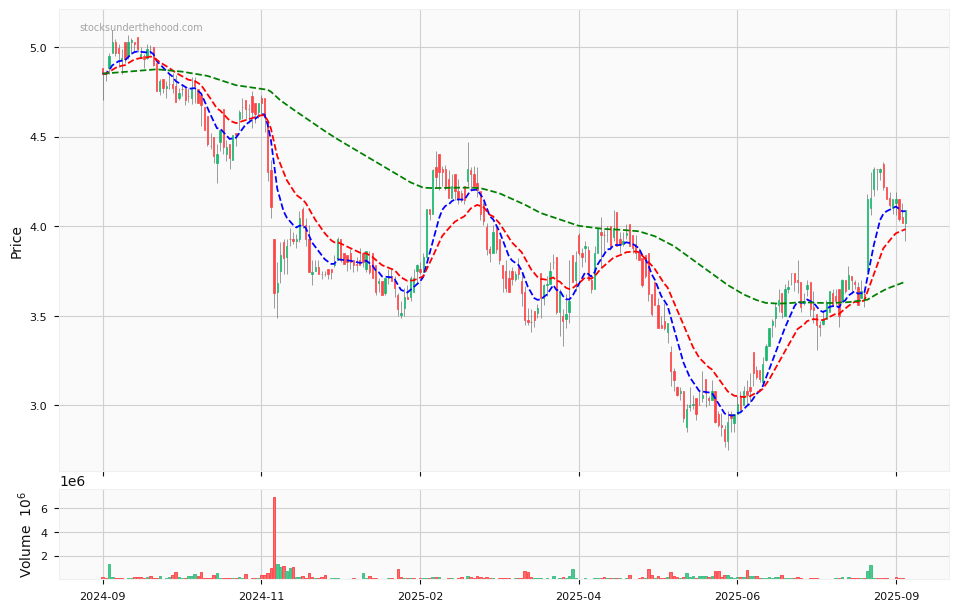
IPG Price Chart with Volume and 3EMA
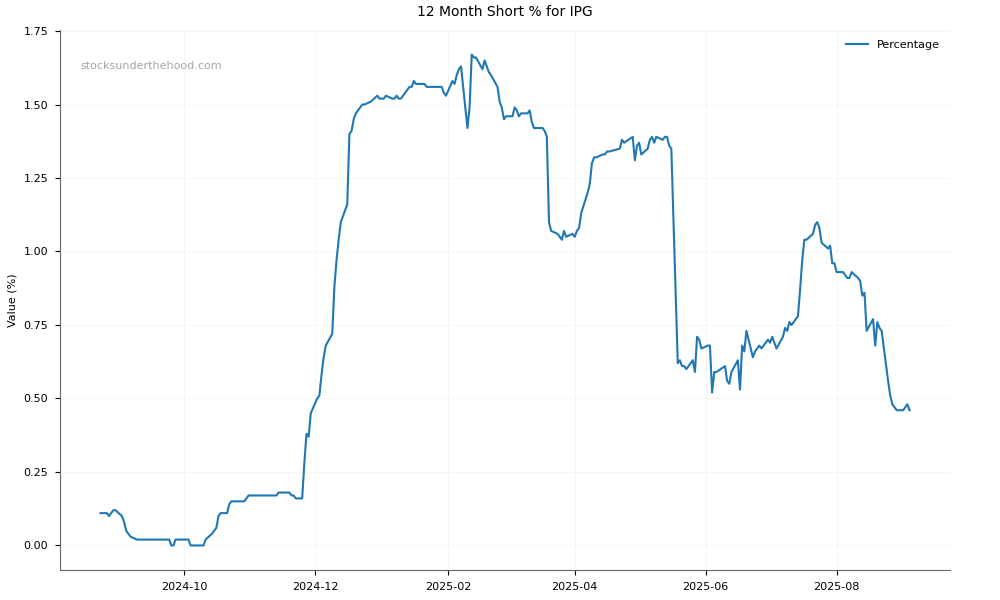
IPG Short Positions
Click HERE to understand why the above moving averages have been chosen.