James Hardie Industries plc (ASX:JHX) manufactures and sells fiber cement and gypsum products for building applications like siding and cladding. They operate in North America, Asia Pacific, and Europe with brands like HardiePlank.
Ticker code: JHX
Sector: Basic Materials | Industry: Building Materials | Website: https://www.jameshardie.com
Market Information
| Market Capitalisation | Enterprise Value | Shares Outstanding | Free Float [%] | Free Float Value |
|---|---|---|---|---|
| $16,659,448,220 | $21,348,848,028 | 579257583 | 99.4 | $16,559,437,160 |
Balance Sheet & Quality
| Equity | Cash | Debt | Return On Equity (ROE) | EBITDA 25 Margin [%] | Net Debt / Equity [%] | Rule of 40 |
|---|---|---|---|---|---|---|
| $9,521,983,032 | $566,700,032 | $5,256,099,840 | 6.8 | 28.0 | 49.2 | 27.6 |
Technicals & Short Data
| 3EMA Status | Volatility [%] | Value Traded Today | Average Daily Liquidity | Short [%] | Days To Cover |
|---|---|---|---|---|---|
| Partial | 13.4 | $102,448,528 | $122,548,029 | 2.38 | 3.2 |
Dividends
| Previous Dividend | Last Dividend | Franking [%] | Ex-Div Date | Gross Yield [%] |
|---|---|---|---|---|
| None | None | None | 2022-05-26 | 0.0 |
Price Performance Snapshot
| Last Traded Price | Change [%] | 1 Week [%] | 1 Month [%] | 3 Months [%] | 6 Months [%] | 12 Months [%] |
|---|---|---|---|---|---|---|
| $28.760 | -3.0 | -2.9 | 8.7 | -3.9 | -28.2 | -47.6 |
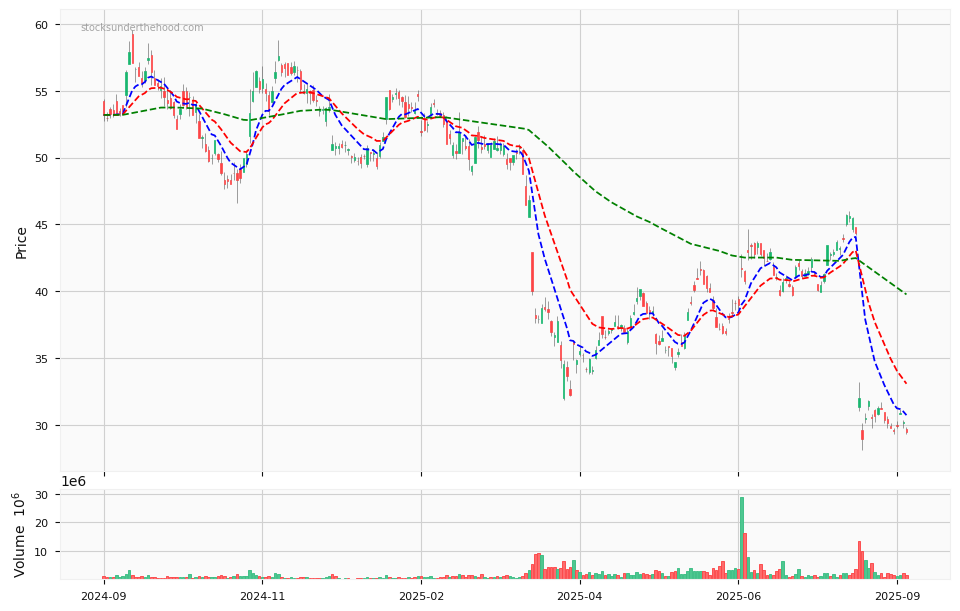
JHX Price Chart with Volume and 3EMA
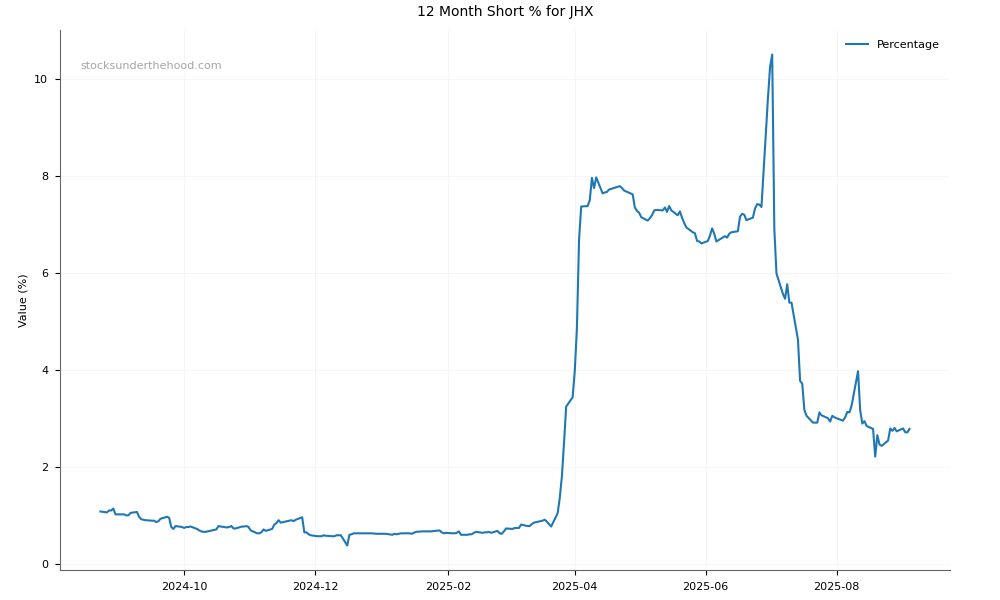
JHX Short Positions
Click HERE to understand why the above moving averages have been chosen.