Kelly Partners Group Holdings Limited is an integrated financial services firm offering accounting, taxation, and audit services to private clients, businesses, and families in Australia.
Ticker code: KPG
Sector: Industrials | Industry: Specialty Business Services | Website: https://kellypartnersgroup.com.au
Market Information
| Market Capitalisation | Enterprise Value | Shares Outstanding | Free Float [%] | Free Float Value |
|---|---|---|---|---|
| $461,804,553 | $556,819,553 | 45274957 | 49.02 | $226,358,120 |
Balance Sheet & Quality
| Equity | Cash | Debt | Return On Equity (ROE) | EBITDA 25 Margin [%] | Net Debt / Equity [%] | Rule of 40 |
|---|---|---|---|---|---|---|
| $28,432,675 | $6,867,000 | $101,882,000 | 36.4 | 33.5 | 334.2 | 47.0 |
Technicals & Short Data
| 3EMA Status | Volatility [%] | Value Traded Today | Average Daily Liquidity | Short [%] | Days To Cover |
|---|---|---|---|---|---|
| Negative | 3.2 | $391,843 | $441,109 | 0.26 | 2.7 |
Dividends
| Previous Dividend | Last Dividend | Franking [%] | Ex-Div Date | Gross Yield [%] |
|---|---|---|---|---|
| None | None | 100.0 | 2024-02-20 | 0.0 |
Price Performance Snapshot
| Last Traded Price | Change [%] | 1 Week [%] | 1 Month [%] | 3 Months [%] | 6 Months [%] | 12 Months [%] |
|---|---|---|---|---|---|---|
| $10.200 | -1.8 | -1.8 | -1.7 | -5.7 | -6.0 | 21.0 |
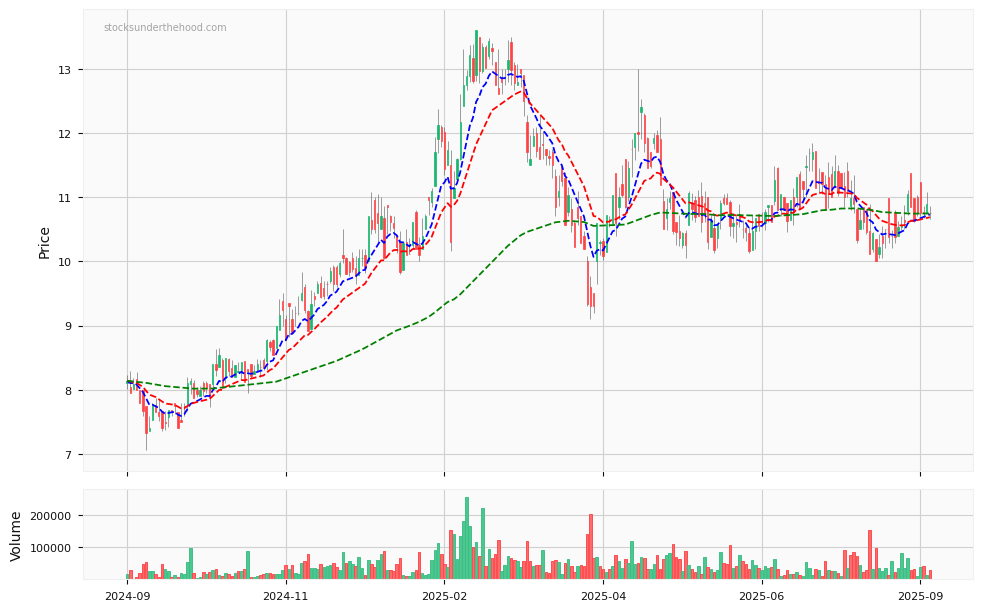
KPG Price Chart with Volume and 3EMA
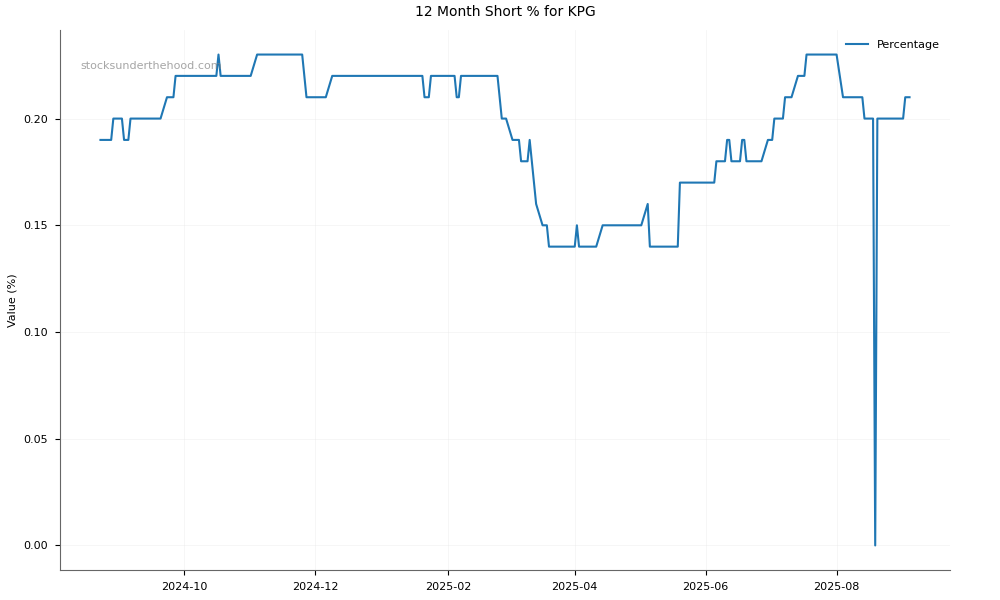
KPG Short Positions
Click HERE to understand why the above moving averages have been chosen.