Light & Wonder, Inc., formerly known as Scientific Games Corporation, is a global leader in cross-platform games and entertainment, providing game content, technology, and services for casino, online, and in-person gaming.
Ticker code: LNW
Sector: Consumer Cyclical | Industry: Gambling | Website: https://www.lnw.com
Market Information
| Market Capitalisation | Enterprise Value | Shares Outstanding | Free Float [%] | Free Float Value |
|---|---|---|---|---|
| $12,343,531,424 | $17,101,531,296 | 81523883 | 88.91 | $10,974,757,282 |
Balance Sheet & Quality
| Equity | Cash | Debt | Return On Equity (ROE) | EBITDA 25 Margin [%] | Net Debt / Equity [%] | Rule of 40 |
|---|---|---|---|---|---|---|
| $1,064,141,111 | $236,000,000 | $4,993,999,872 | 50.2 | 43.0 | 447.1 | 46.2 |
Technicals & Short Data
| 3EMA Status | Volatility [%] | Value Traded Today | Average Daily Liquidity | Short [%] | Days To Cover |
|---|---|---|---|---|---|
| Positive | 16.1 | $33,088,082 | $69,980,795 | None | 0.0 |
Dividends
| Previous Dividend | Last Dividend | Franking [%] | Ex-Div Date | Gross Yield [%] |
|---|---|---|---|---|
| None | None | None | None | 0.0 |
Price Performance Snapshot
| Last Traded Price | Change [%] | 1 Week [%] | 1 Month [%] | 3 Months [%] | 6 Months [%] | 12 Months [%] |
|---|---|---|---|---|---|---|
| $151.410 | -0.1 | 1.1 | 8.0 | 11.5 | 15.9 | 3.4 |
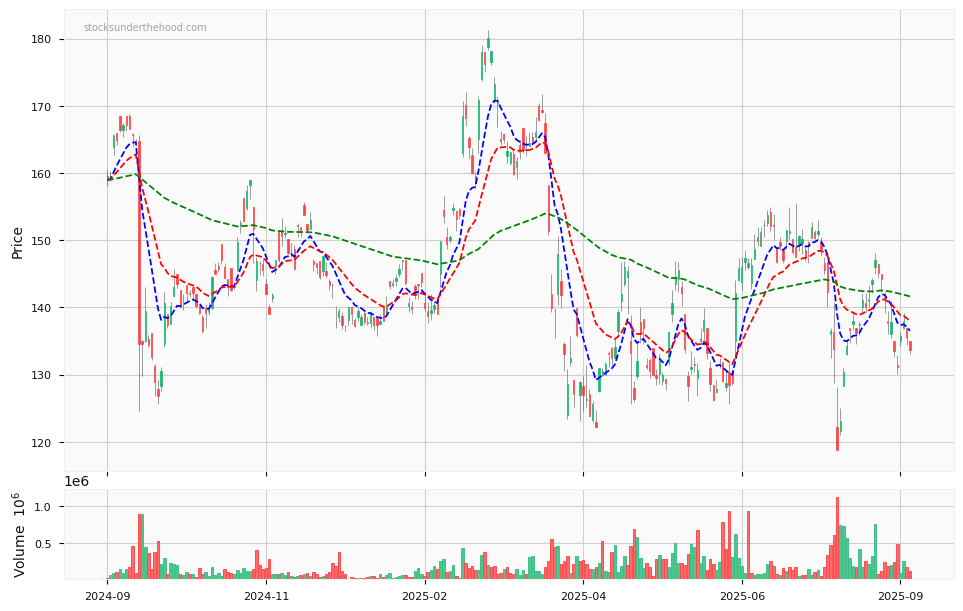
LNW Price Chart with Volume and 3EMA
LNW Short Positions

Click HERE to understand why the above moving averages have been chosen.