Ticker code: ASX:LYC
ASX:LYC Red Flags & Risk Indicators
❌
❌
⚠️ RED FLAGS: 4 identified
- Falling Earnings
- High Price to Book vs ROE
- High Relative Valuation
- Falling EBITDA Margins
Income Statement
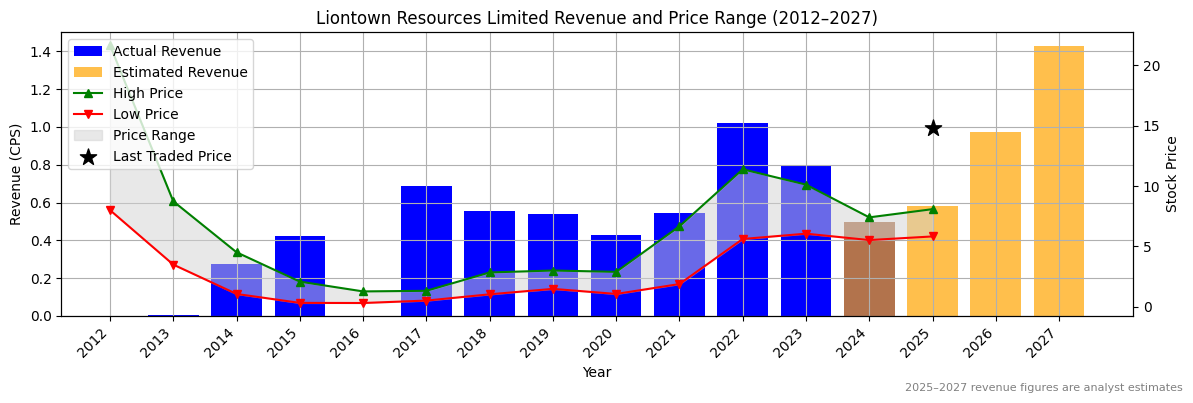
| Revenue 2024 Per Share | Revenue 2025e Per Share | Revenue 2026e Per Share | Revenue 24 to 25e [%] | Revenue 25e to 26e [%] | EBITDA 2024 Per Share | EBITDA 2025e Per Share | EBITDA 2026e Per Share | EBITDA 24 to 25e [%] | EBITDA 25e to 26e [%] |
|---|---|---|---|---|---|---|---|---|---|
| 0.49613 | 0.57979 | 0.97524 | 16.9 | 68.2 | 0.1415 | 0.12937 | 0.40098 | -8.6 | 209.9 |
ASX:LYC Revenue Per Share (2012–2027)
✅
✅
ASX:LYC Earnings before Interest, Tax, Depreciation and Amortisation (EBITDA) Per Share (2012–2027)
❌
❌

ASX:LYC Normalised Earnings Per Share (EPS) (2012–2027)
❌
❌

Valuation
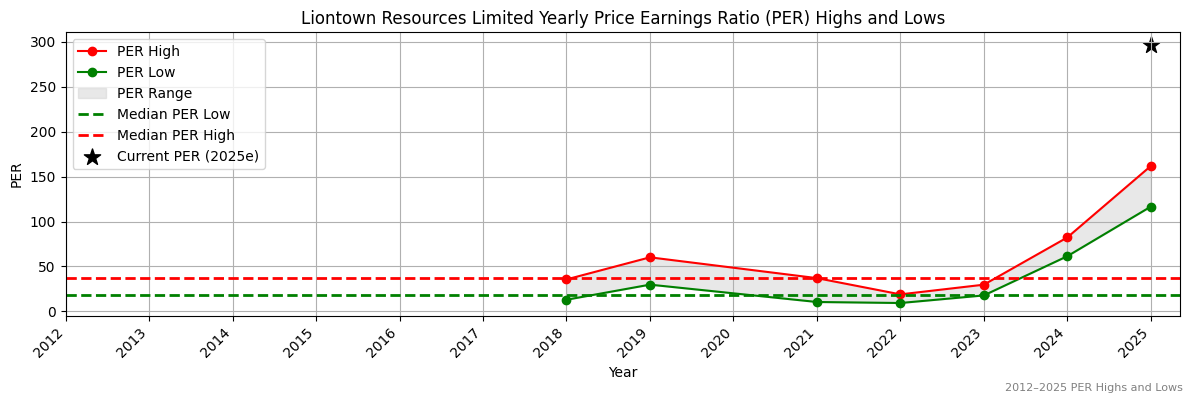
| Price To Sales | Price To Book | PER 2023 | PER 2024 | 13Y Median PER Low | PER 2025e | 13Y Median PER High | PER 2026e | Last Updated |
|---|---|---|---|---|---|---|---|---|
| 26.4 | 5.9 | 43.6 | 164.6 | 17.8 | 296.2 | 37.1 | 61.7 | 24/7/25 |
ASX:LYC Yearly Price Earnings Ratio (PER) Highs and Lows
❌
❌
ASX:LYC Weekly Price Chart with Average True Range (ATR) Trailing Stop (10-Year View)
