Lynch Group Holdings Limited is a vertically integrated wholesaler and retailer of floral and plant products, supplying supermarkets and retailers across Australia and China.
Ticker code: LGL
Sector: Consumer Defensive | Industry: Farm Products | Website: https://www.lynchgroup.com.au
Market Information
| Market Capitalisation | Enterprise Value | Shares Outstanding | Free Float [%] | Free Float Value |
|---|---|---|---|---|
| $268,176,223 | $332,203,223 | 124733127 | 39.91 | $107,037,028 |
Balance Sheet & Quality
| Equity | Cash | Debt | Return On Equity (ROE) | EBITDA 25 Margin [%] | Net Debt / Equity [%] | Rule of 40 |
|---|---|---|---|---|---|---|
| None | $30,831,000 | $94,858,000 | 4.9 | 9.5 | 0.0 | 15.4 |
Technicals & Short Data
| 3EMA Status | Volatility [%] | Value Traded Today | Average Daily Liquidity | Short [%] | Days To Cover |
|---|---|---|---|---|---|
| Partial | None | None | None | 0.0 | 0.0 |
Dividends
| Previous Dividend | Last Dividend | Franking [%] | Ex-Div Date | Gross Yield [%] |
|---|---|---|---|---|
| $0.050 | $0.090 | None | 2025-09-02 | 4.2 |
Price Performance Snapshot
| Last Traded Price | Change [%] | 1 Week [%] | 1 Month [%] | 3 Months [%] | 6 Months [%] | 12 Months [%] |
|---|---|---|---|---|---|---|
| None | None | None | None | None | None | None |
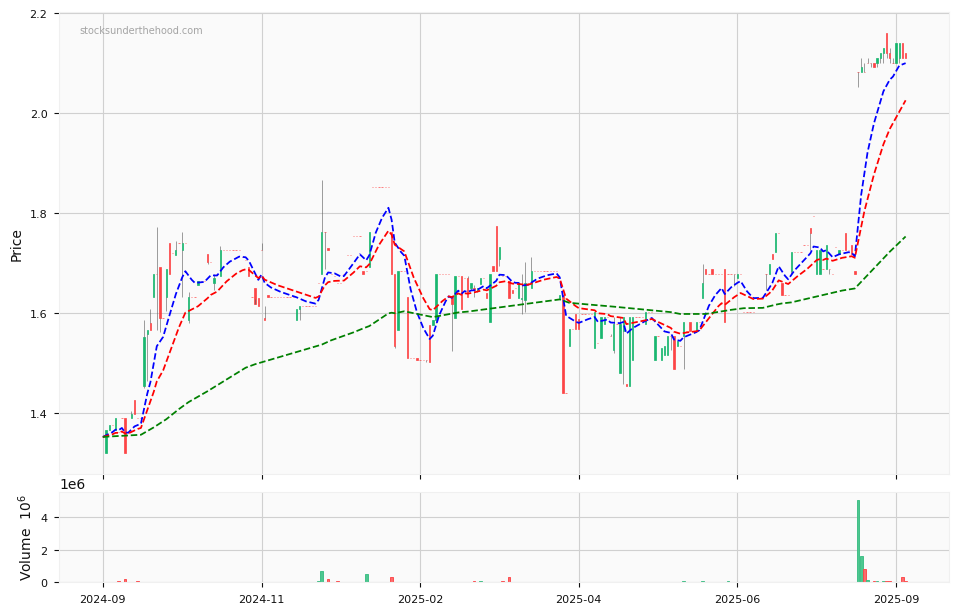
LGL Price Chart with Volume and 3EMA
LGL Short Positions

Click HERE to understand why the above moving averages have been chosen.