MA Financial Group Limited, formerly known as Moelis Australia, is a diversified financial services firm offering asset management, lending, corporate advisory, and equities services.
Ticker code: MAF
Sector: Financial Services | Industry: Asset Management | Website: https://www.mafinancial.com
Market Information
| Market Capitalisation | Enterprise Value | Shares Outstanding | Free Float [%] | Free Float Value |
|---|---|---|---|---|
| $2,044,158,740 | $8,145,704,660 | 194867377 | 59.92 | $1,224,958,677 |
Balance Sheet & Quality
| Equity | Cash | Debt | Return On Equity (ROE) | EBITDA 25 Margin [%] | Net Debt / Equity [%] | Rule of 40 |
|---|---|---|---|---|---|---|
| $490,870,904 | $386,494,016 | $6,488,039,936 | 13.9 | 32.8 | 1243.0 | 39.4 |
Technicals & Short Data
| 3EMA Status | Volatility [%] | Value Traded Today | Average Daily Liquidity | Short [%] | Days To Cover |
|---|---|---|---|---|---|
| Positive | 5.4 | $4,111,062 | $4,025,181 | 1.67 | 8.5 |
Dividends
| Previous Dividend | Last Dividend | Franking [%] | Ex-Div Date | Gross Yield [%] |
|---|---|---|---|---|
| $0.140 | $0.060 | 100.0 | 2025-09-02 | 0.8 |
Price Performance Snapshot
| Last Traded Price | Change [%] | 1 Week [%] | 1 Month [%] | 3 Months [%] | 6 Months [%] | 12 Months [%] |
|---|---|---|---|---|---|---|
| $10.490 | 2.8 | 7.0 | 6.0 | 14.6 | 47.4 | 74.9 |
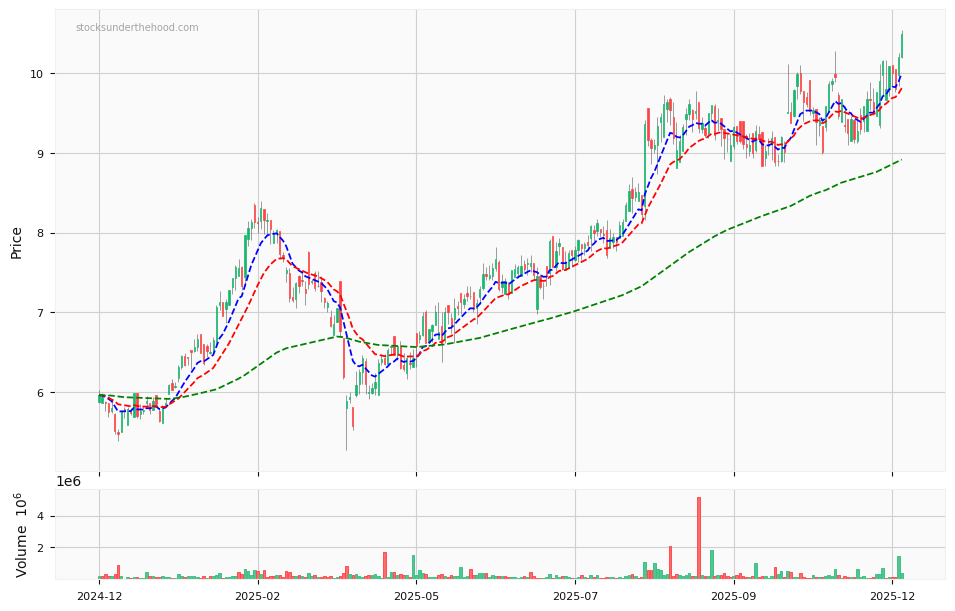
MAF Price Chart with Volume and 3EMA
MAF Short Positions

Click HERE to understand why the above moving averages have been chosen.