Macquarie Group Limited is a global financial services provider engaged in banking, investment management, advisory, and capital markets, with operations spanning multiple industries.
Ticker code: MQG
Sector: Financial Services | Industry: Capital Markets | Website: https://www.macquarie.com.au
Market Information
| Market Capitalisation | Enterprise Value | Shares Outstanding | Free Float [%] | Free Float Value |
|---|---|---|---|---|
| $75,054,771,632 | $172,796,767,664 | 385073984 | 94.7 | $71,075,657,009 |
Balance Sheet & Quality
| Equity | Cash | Debt | Return On Equity (ROE) | EBITDA 25 Margin [%] | Net Debt / Equity [%] | Rule of 40 |
|---|---|---|---|---|---|---|
| $34,169,155,764 | $78,932,000,768 | $176,673,996,800 | 10.9 | 35.7 | 286.1 | 36.4 |
Technicals & Short Data
| 3EMA Status | Volatility [%] | Value Traded Today | Average Daily Liquidity | Short [%] | Days To Cover |
|---|---|---|---|---|---|
| Negative | 6.1 | $102,007,125 | $141,418,512 | 0.39 | 2.1 |
Dividends
| Previous Dividend | Last Dividend | Franking [%] | Ex-Div Date | Gross Yield [%] |
|---|---|---|---|---|
| $3.900 | $2.800 | 40.0 | 2025-11-17 | 1.6 |
Price Performance Snapshot
| Last Traded Price | Change [%] | 1 Week [%] | 1 Month [%] | 3 Months [%] | 6 Months [%] | 12 Months [%] |
|---|---|---|---|---|---|---|
| $194.910 | -0.9 | 0.5 | -4.0 | -10.9 | -8.5 | -11.2 |
MQG Price Chart with Volume and 3EMA

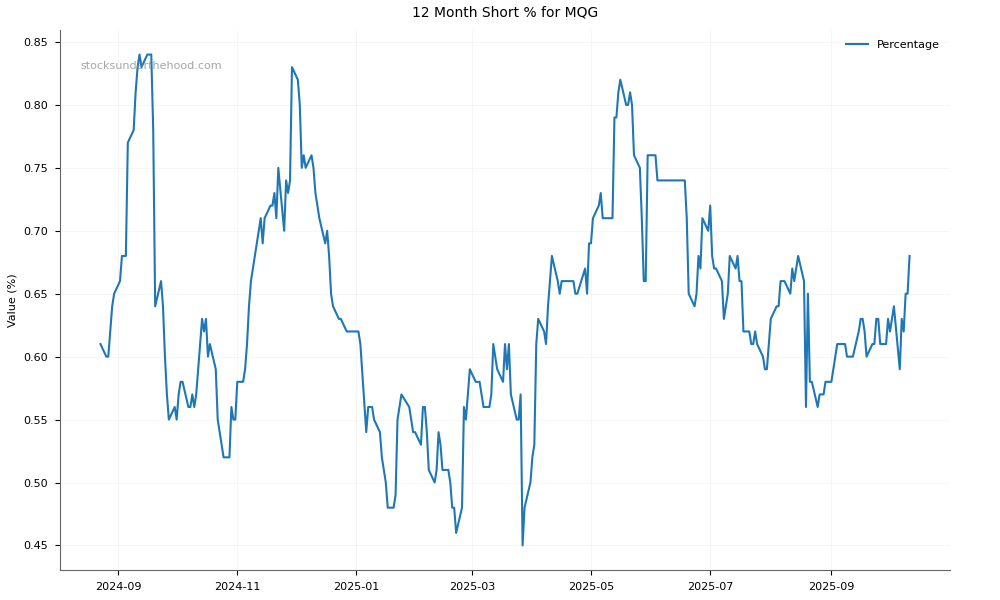
MQG Short Positions
Click HERE to understand why the above moving averages have been chosen.